SDA Operations / tshoot
SDA Operations / tshoot
LISP vs BGP in Cisco SDA
In Software-Defined Access:
LISP = fabric internal control plane 🧠
(endpoint location + VXLAN tunnel resolution)
BGP = external route exchange 🌍
(connect fabric to outside networks)
They operate in different routing domains but meet at the border node.
BGP runs only at the border node.
Purpose:
- learn external prefixes from fusion routers / upstream
- advertise fabric prefixes outward
- exchange routes between border nodes (iBGP)
Then how is LISP pub sub deployment in SDA different?
Cisco SDA uses a modified LISP publish–subscribe (pub-sub) model, which changes how mappings are distributed, not what LISP does.
Traditional LISP:
Edge nodes ask the control plane for mappings when needed (Map-Request).
SDA LISP pub-sub:
Edge nodes subscribe to mappings, and the control plane pushes updates automatically.
So SDA reduces lookup latency and improves scale ⚡
Classical LISP control-plane behaviour (pull model)
Host A → Host B
Edge node doesn't know B
→ sends Map-Request to control plane
→ receives Map-Reply
→ builds VXLAN tunnel
→ forwards traffic
SDA LISP publish–subscribe model
Edge node registers endpoints
↓
Control plane stores mappings
↓
Other edge nodes subscribe to updates
↓
Mappings pushed proactively
So instead of:
request → reply
you get:
subscribe → push updates automatically
Much faster convergence and fewer queries.
What exactly gets published?
When an endpoint appears:
Host joins fabric
↓
Edge node registers endpoint to Control Plane Node
↓
Control Plane Node distributes mapping to subscribers
Endpoint mappings in its VN (primary subscription)
Example:
If Edge-1 participates in:
VN = Corp
it subscribes to:
All Corp endpoint location updates
So when a device appears anywhere in the Corp VN:
10.10.20.5 → Edge-3 loopback
the Control Plane Node pushes that mapping to Edge-1.
Edge-1 now already knows where that endpoint lives.
No lookup required later.
What triggers subscription updates
Control Plane Node pushes updates when:
New endpoint appears
Host joins fabric
Endpoint roams
Edge changes
Endpoint disappears
Host disconnects
External prefix changes
New route learned via border node
Border nodes also subscribe
Border nodes subscribe too.
They receive:
Internal endpoint mappings
so they know how to forward inbound traffic from:
Fusion router → fabric endpoint
without querying first.
But does it not cause scalability issues and that is why map-request and map-reply model were used if you are learning / pulling all hosts in a VN?
At first glance, pushing all endpoint mappings to all edge nodes in a VN sounds like it would break scalability. That’s exactly why classical LISP used Map-Request / Map-Reply (pull) instead of flooding mappings everywhere.
But Cisco SDA does NOT push all mappings to all edges. It uses a selective pub-sub model, not a full broadcast subscription model.
Here’s how scalability is preserved.
The key clarification
SDA does not mean:
Every edge node learns every endpoint in the VN
Instead it means:
Edge nodes subscribe only to mappings they are likely to need
The control plane node performs selective distribution.
Edges subscribe to:
Local VN mappings (selectively)
Not the entire VN database.
Instead:
- active mappings
- relevant mappings
- recently used mappings
- mobility-related mappings
The control plane node tracks interest dynamically.
Example with numbers (realistic campus)
Suppose:
Fabric size = 10,000 endpoints
Edges = 40
Endpoints per edge ≈ 250
Each edge typically knows:
its own endpoints
+
active remote peers
+
border mappings
NOT:
all 10,000 endpoints
Another hidden scaling mechanism: map-cache still exists
Even in SDA pub-sub mode:
Edge nodes still maintain a map-cache.
So behaviour is actually hybrid:
Push updates when relevant
Pull mappings when unknown
Cache results locally
This keeps control-plane chatter low.
Host-A talked to Edge-1 and Edge-2
Host-A disconnected
→ notify Edge-1 and notify Edge-2
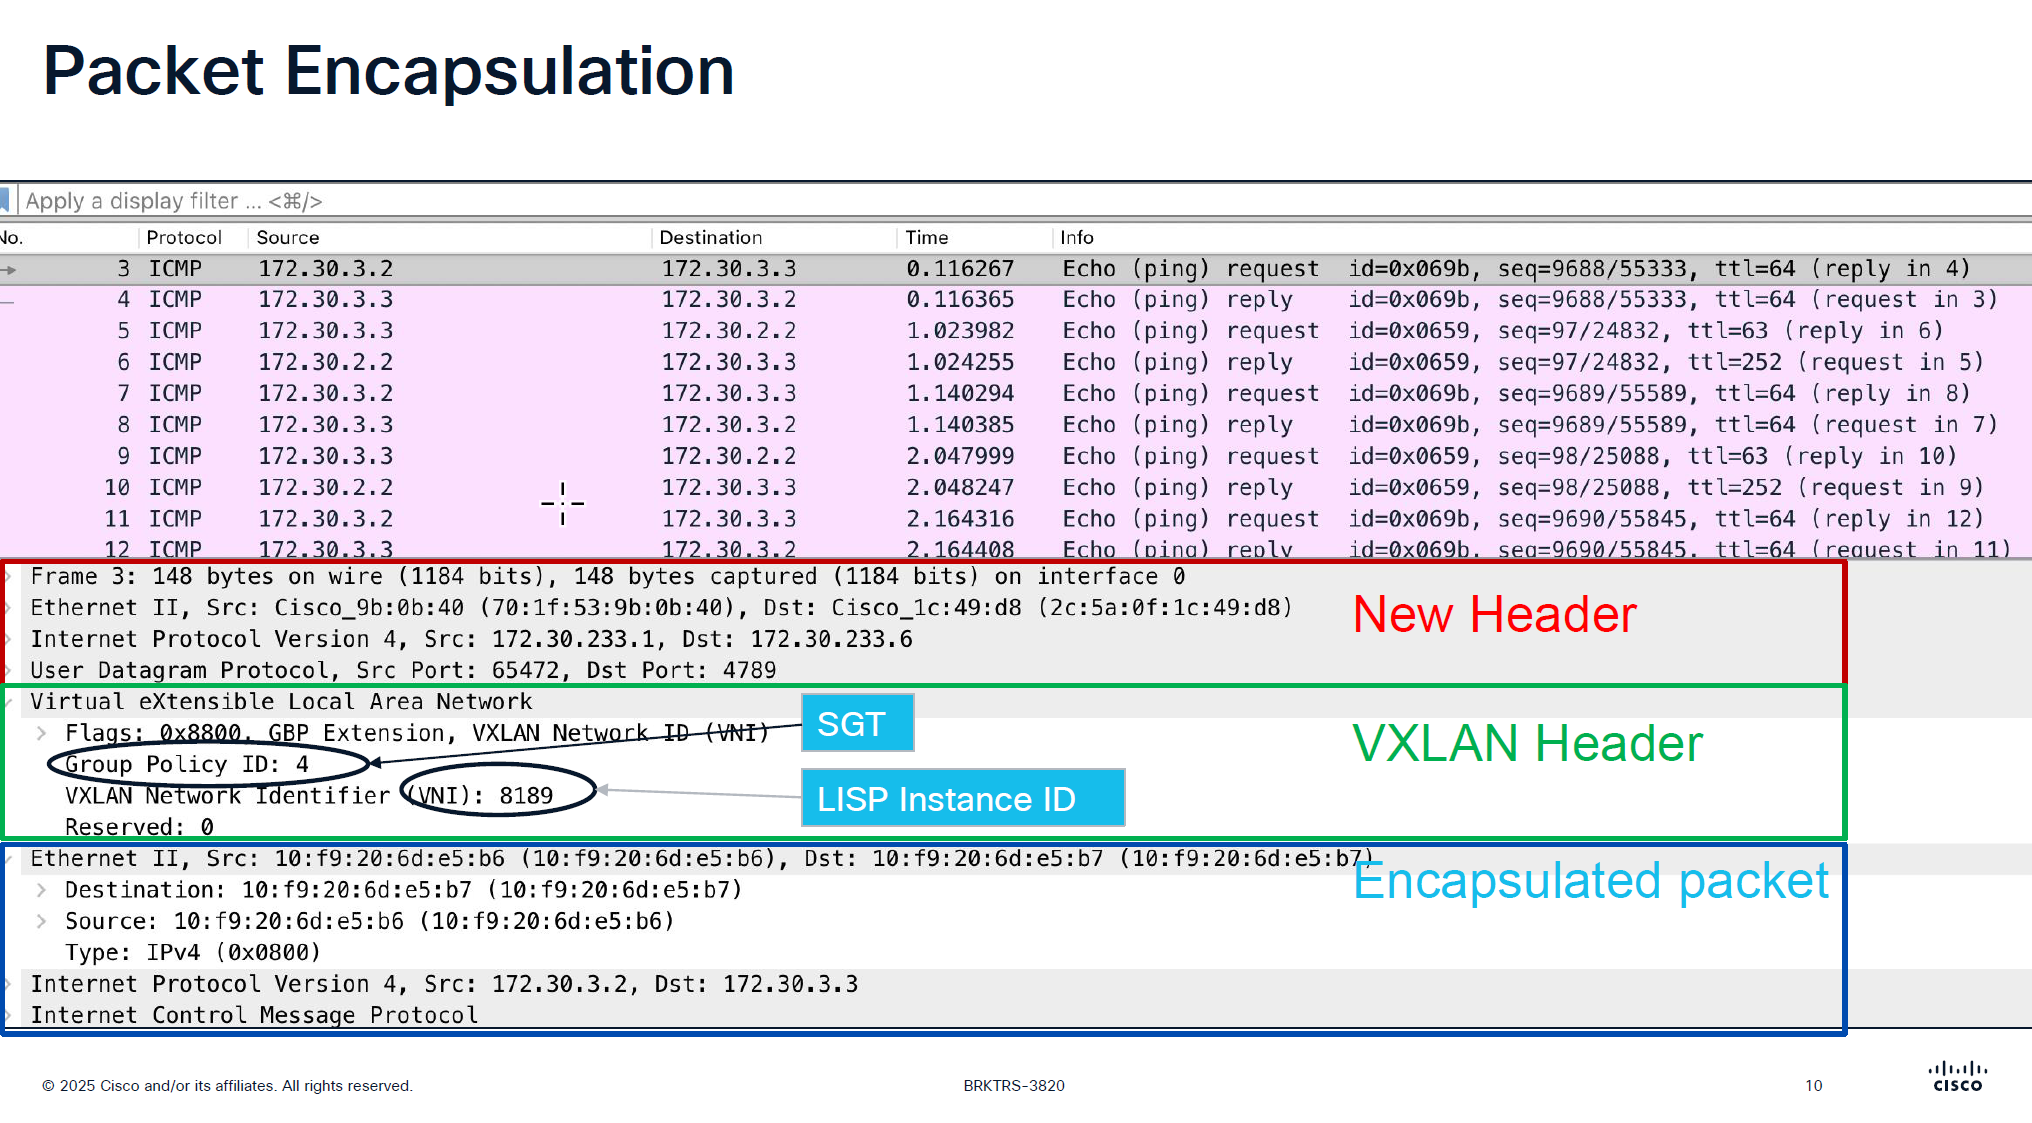
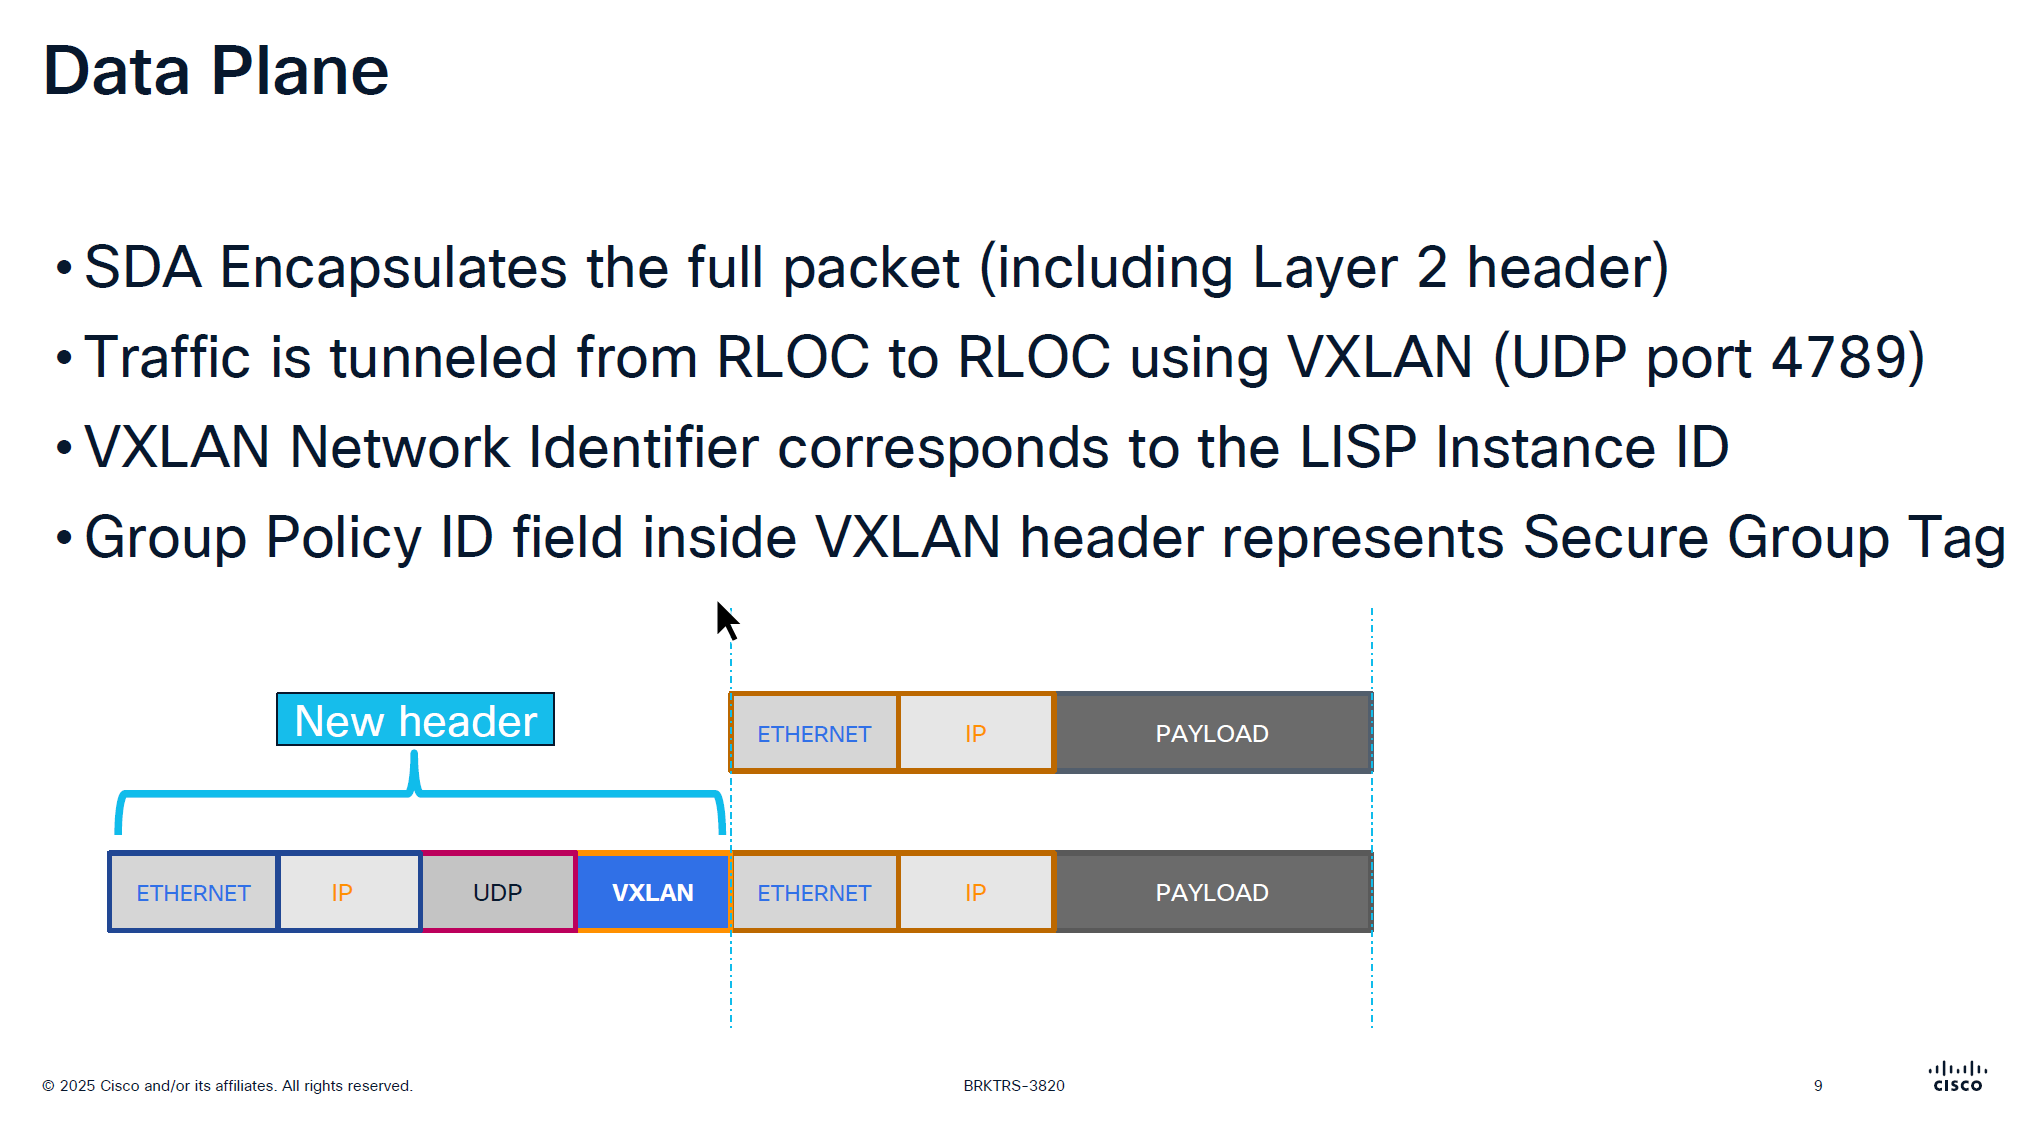
VXLAN looks like an “application” in above picture
Destination Port used by VXLAN is UDP 4’789
Cisco could have used source UDP 4789 to destination UDP 4789 but they wanted the possibility of load balancing through the underlay network that is why Cisco uses random source port because if everything is using same path then we are wasting bandwidth in thet network
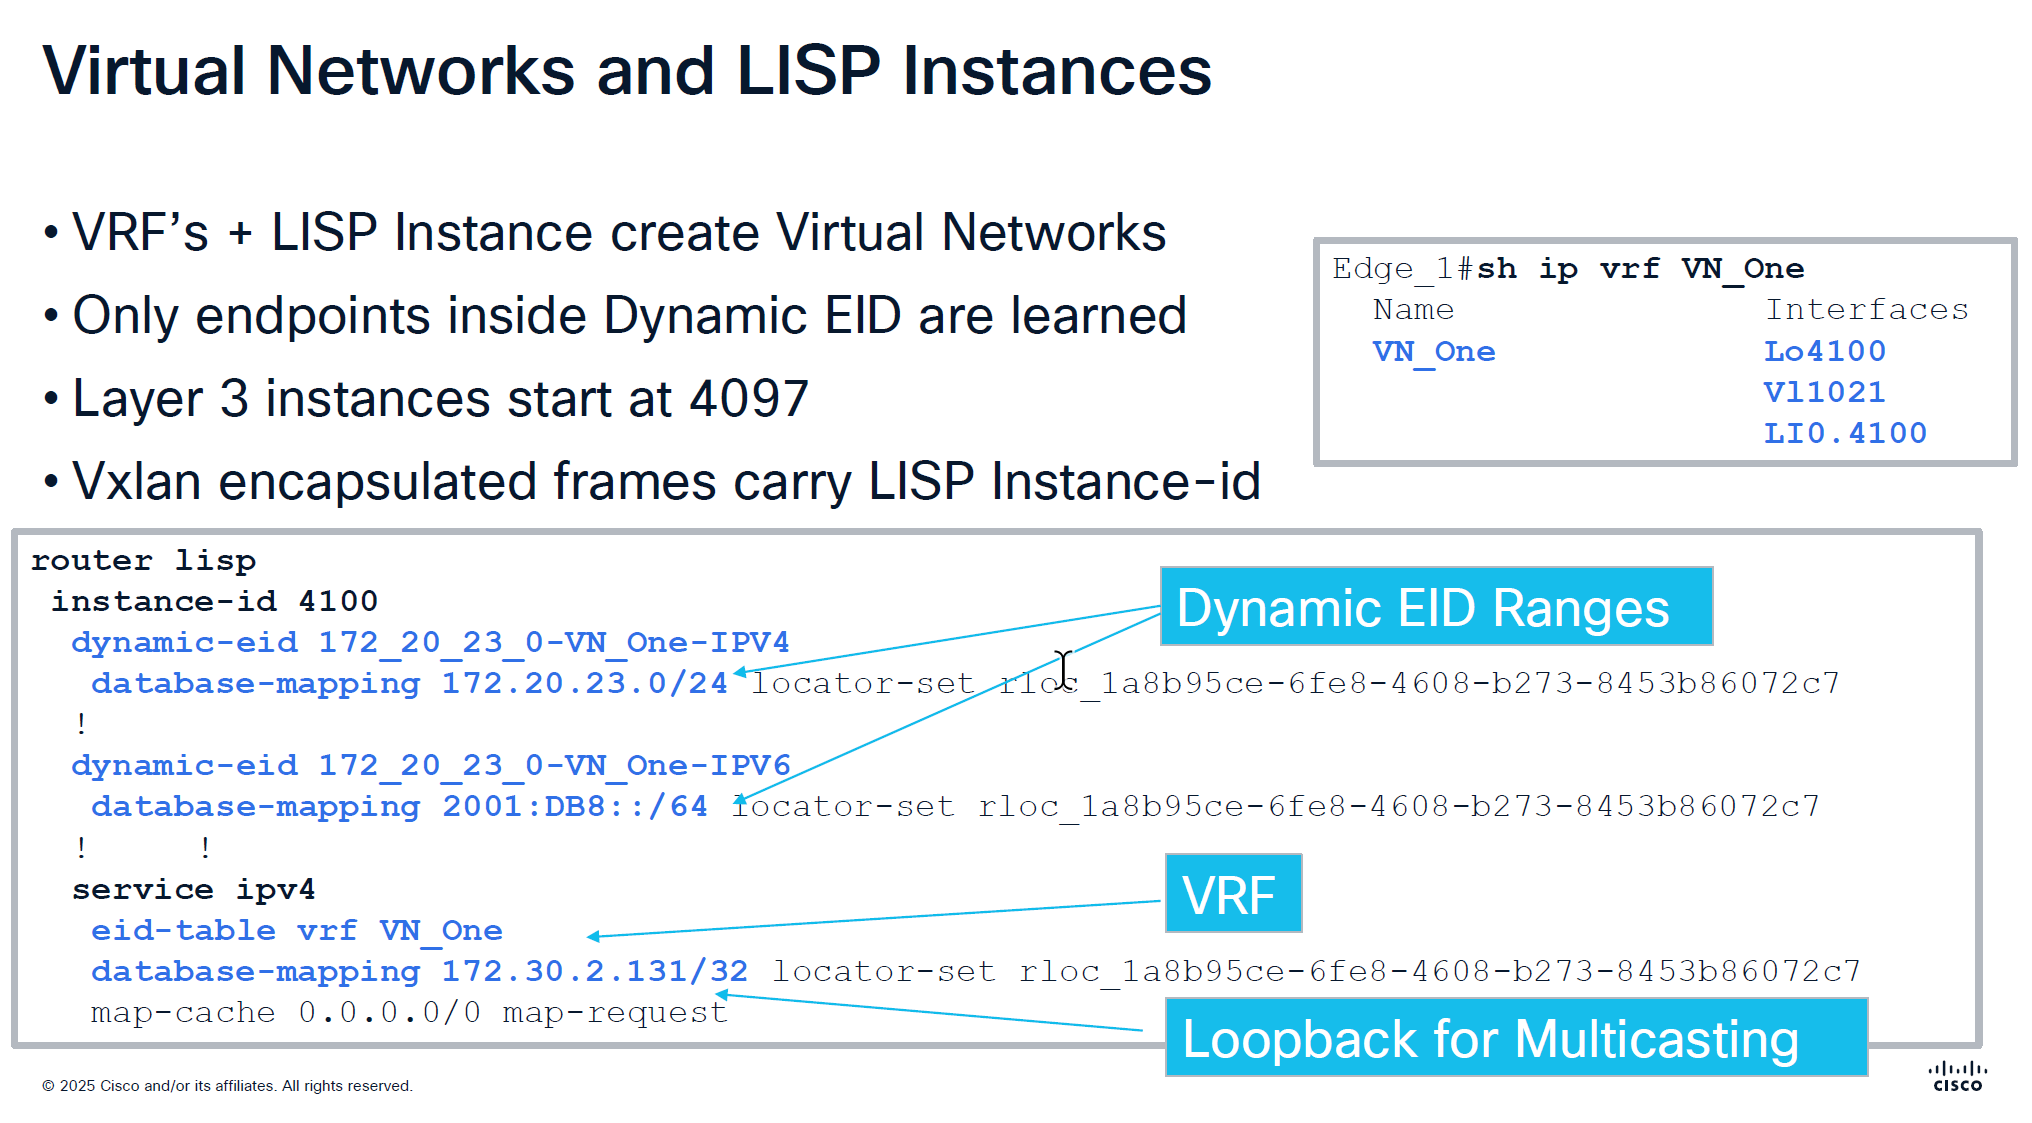
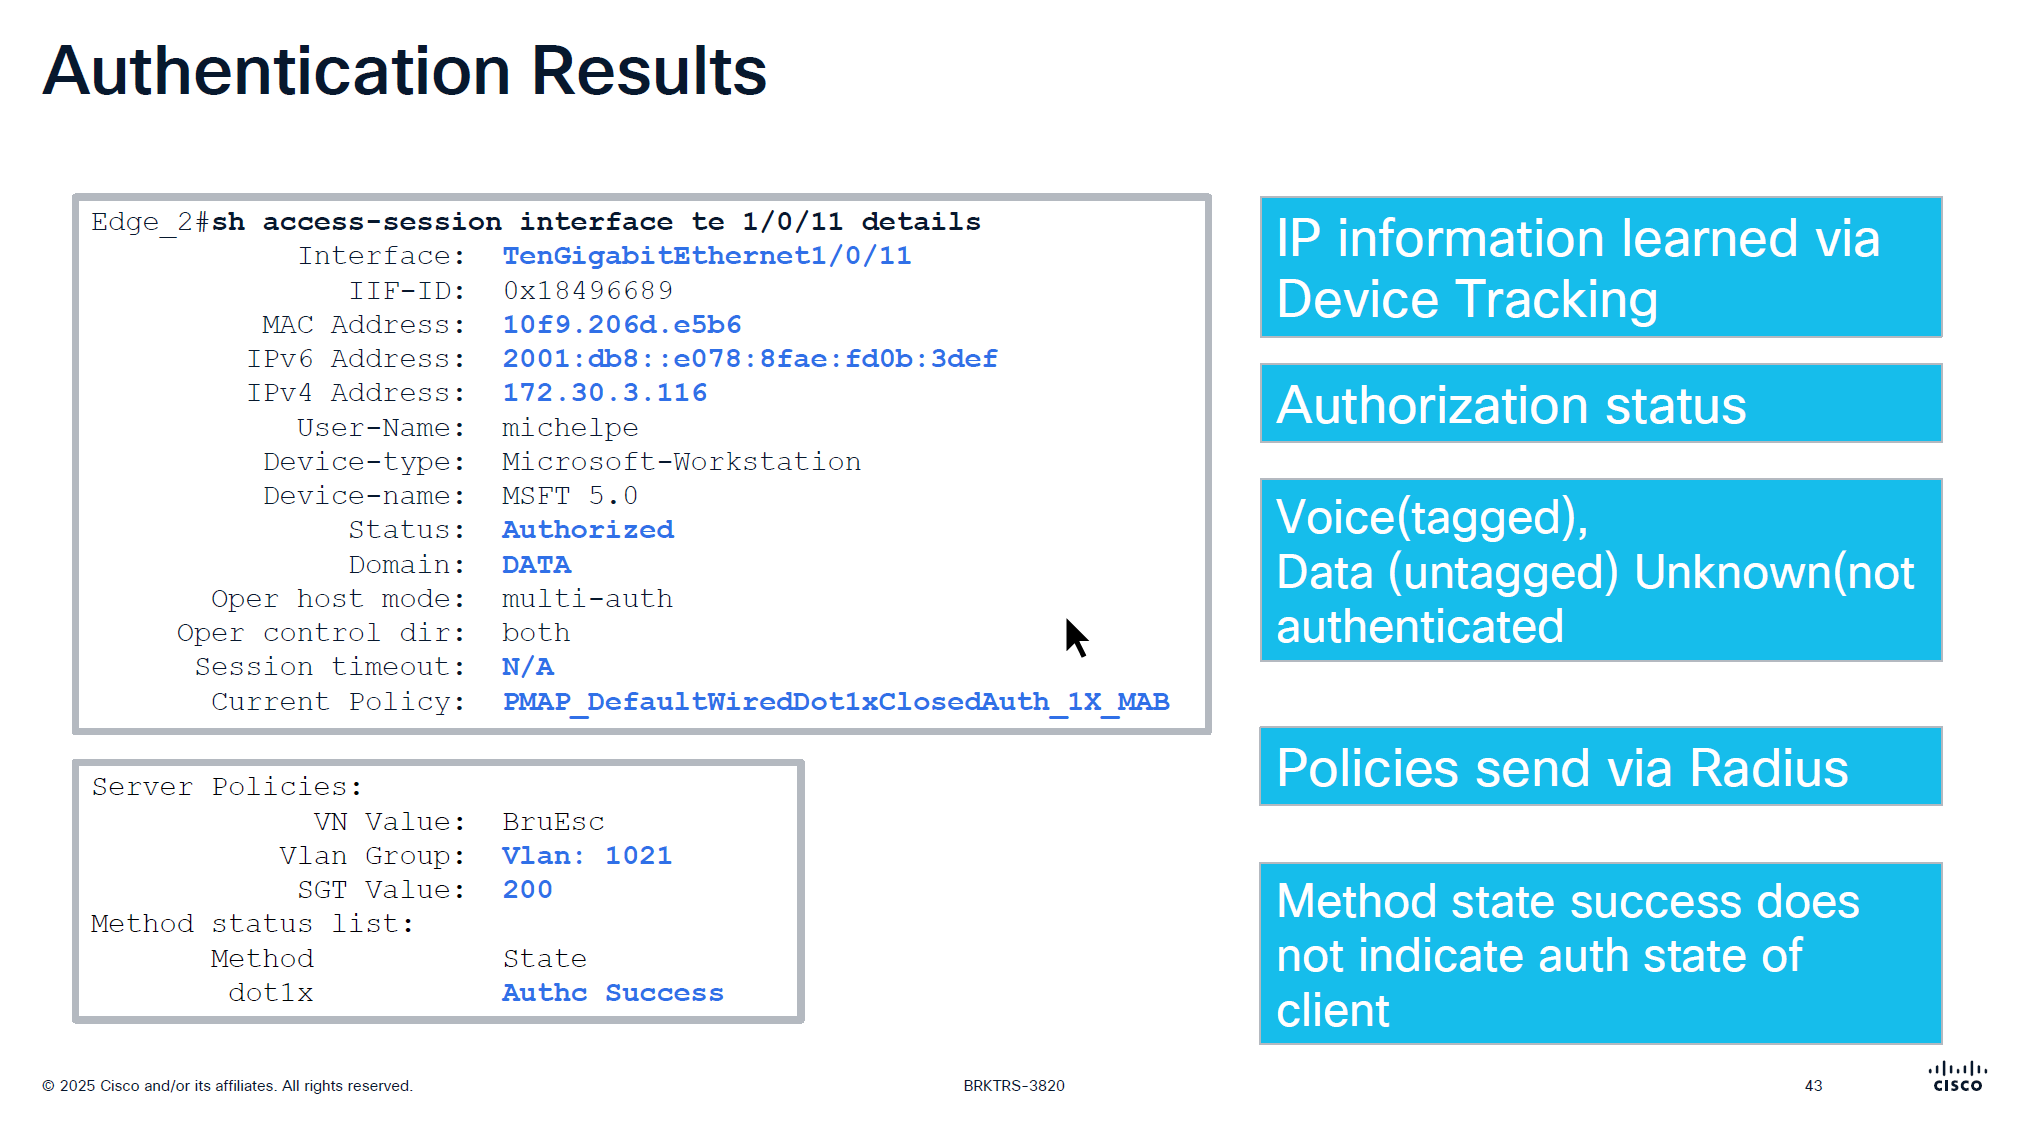
Any endpoint that is connected and is picked up by device tracking and it is in this subnet then it is registered in LISP
but anything outside of this range will still be learned in device tracking but not learned in LISP and will not be advertised out by FBS because security wise anything could connect and get advertised out of the fabric, these endpoints will still be able to speak to devices connected on same switch, but not through fabric
In every VRF a loopback is created dynamically and that loopback is not in underlay but on the overlay, and is used for multicasting and it is shown in above screenshot as “Loopback for Multicasting”
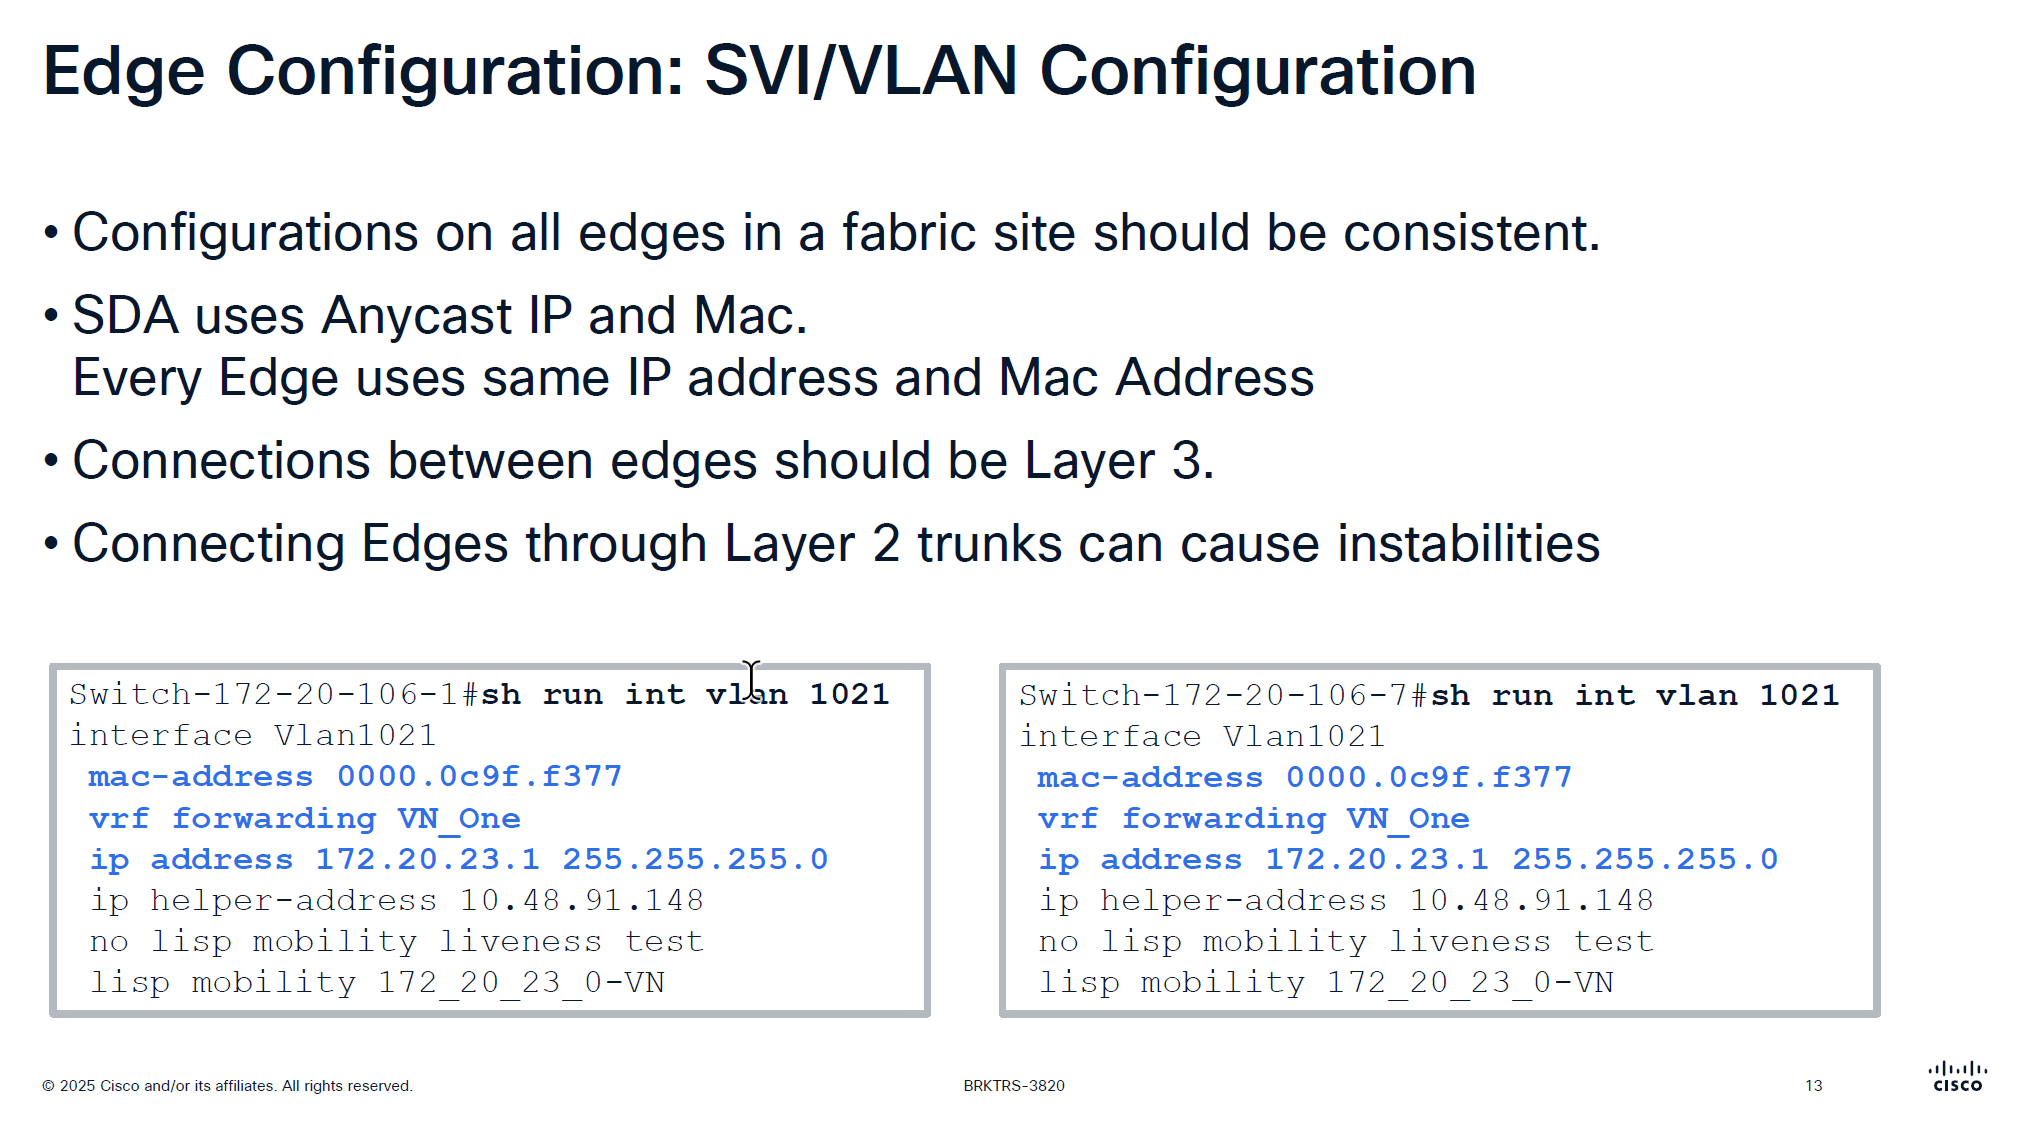
Because we have same Anycast IP and same mac address on all edge devices and because of that we should never connect 2 edges together via a layer 2 trunk, if we do then we will see all sorts of instabilities
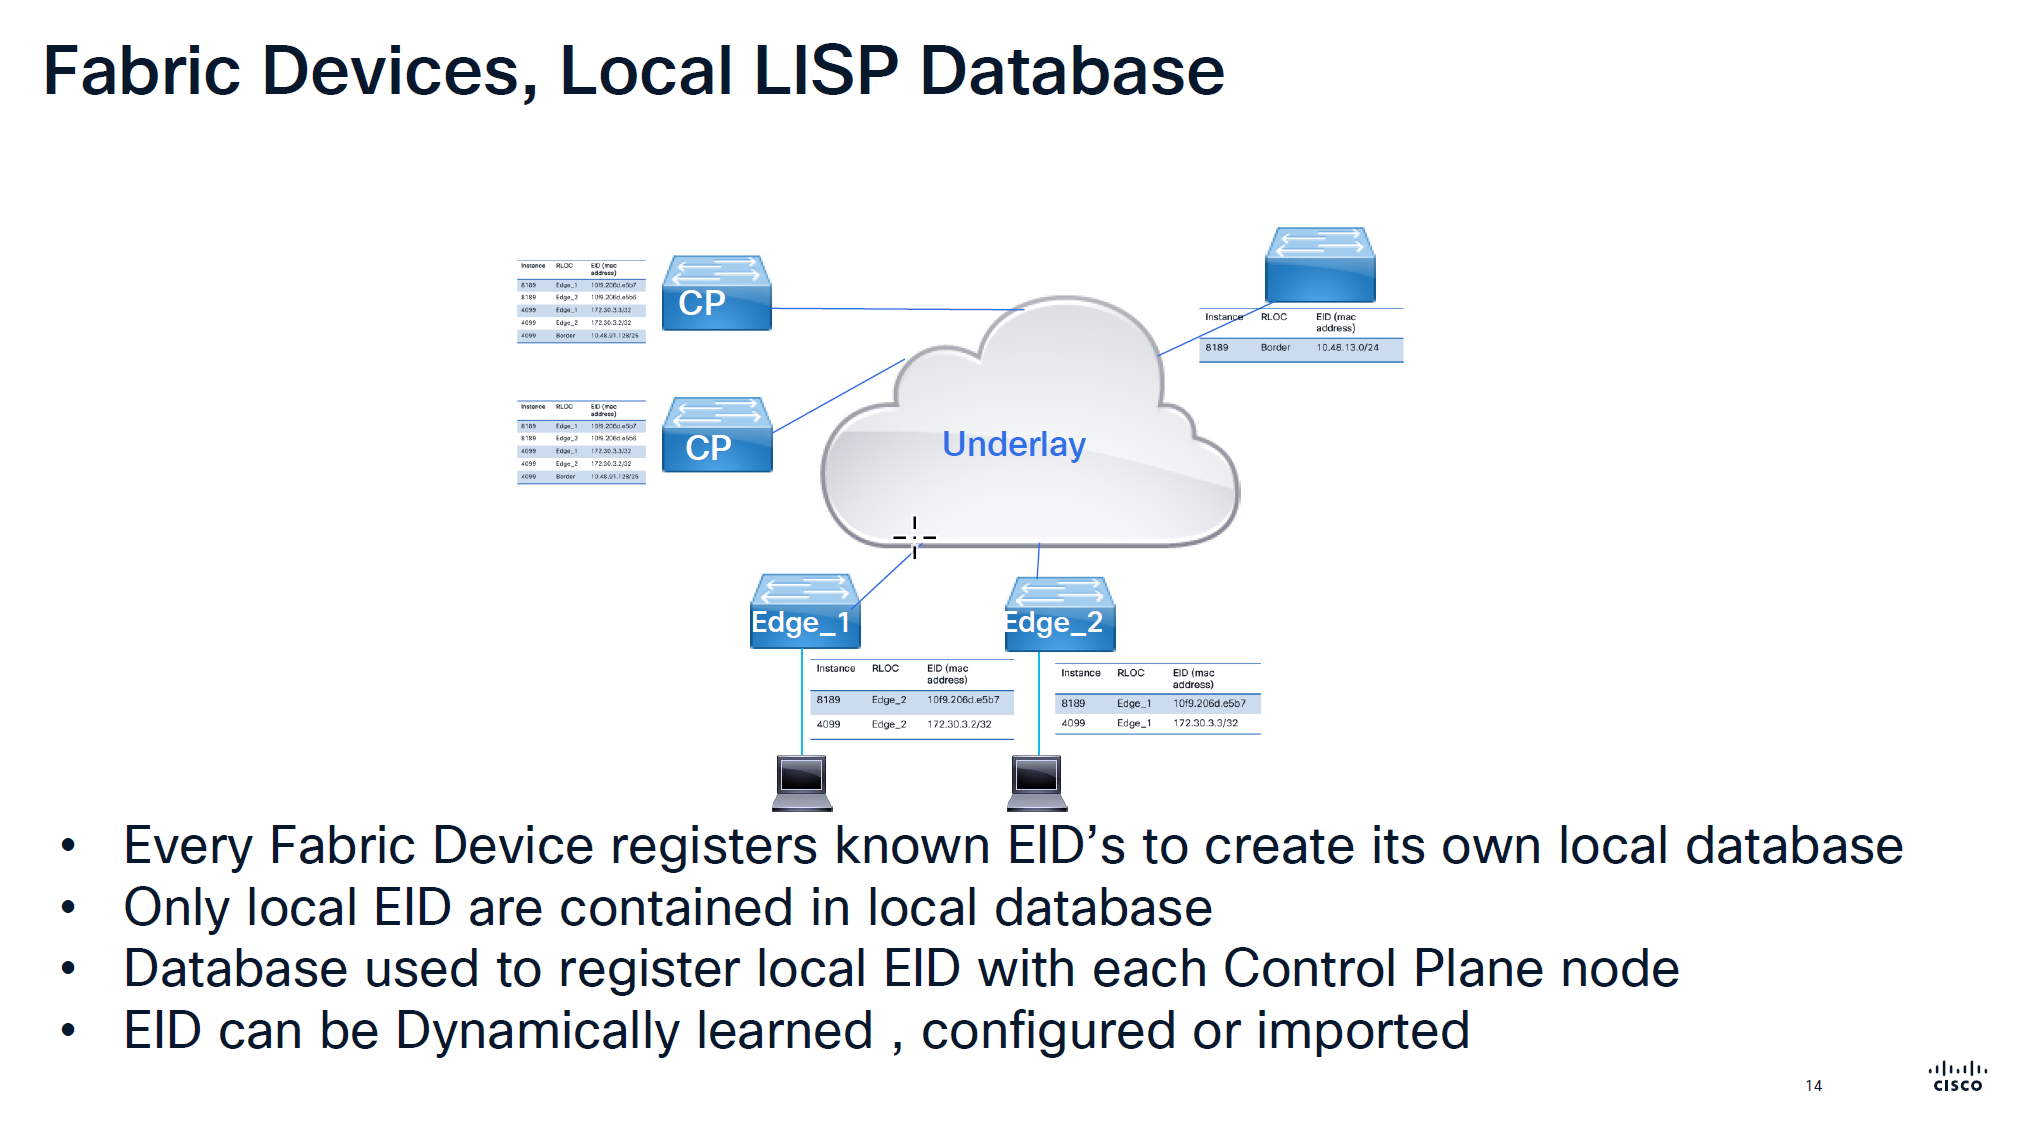
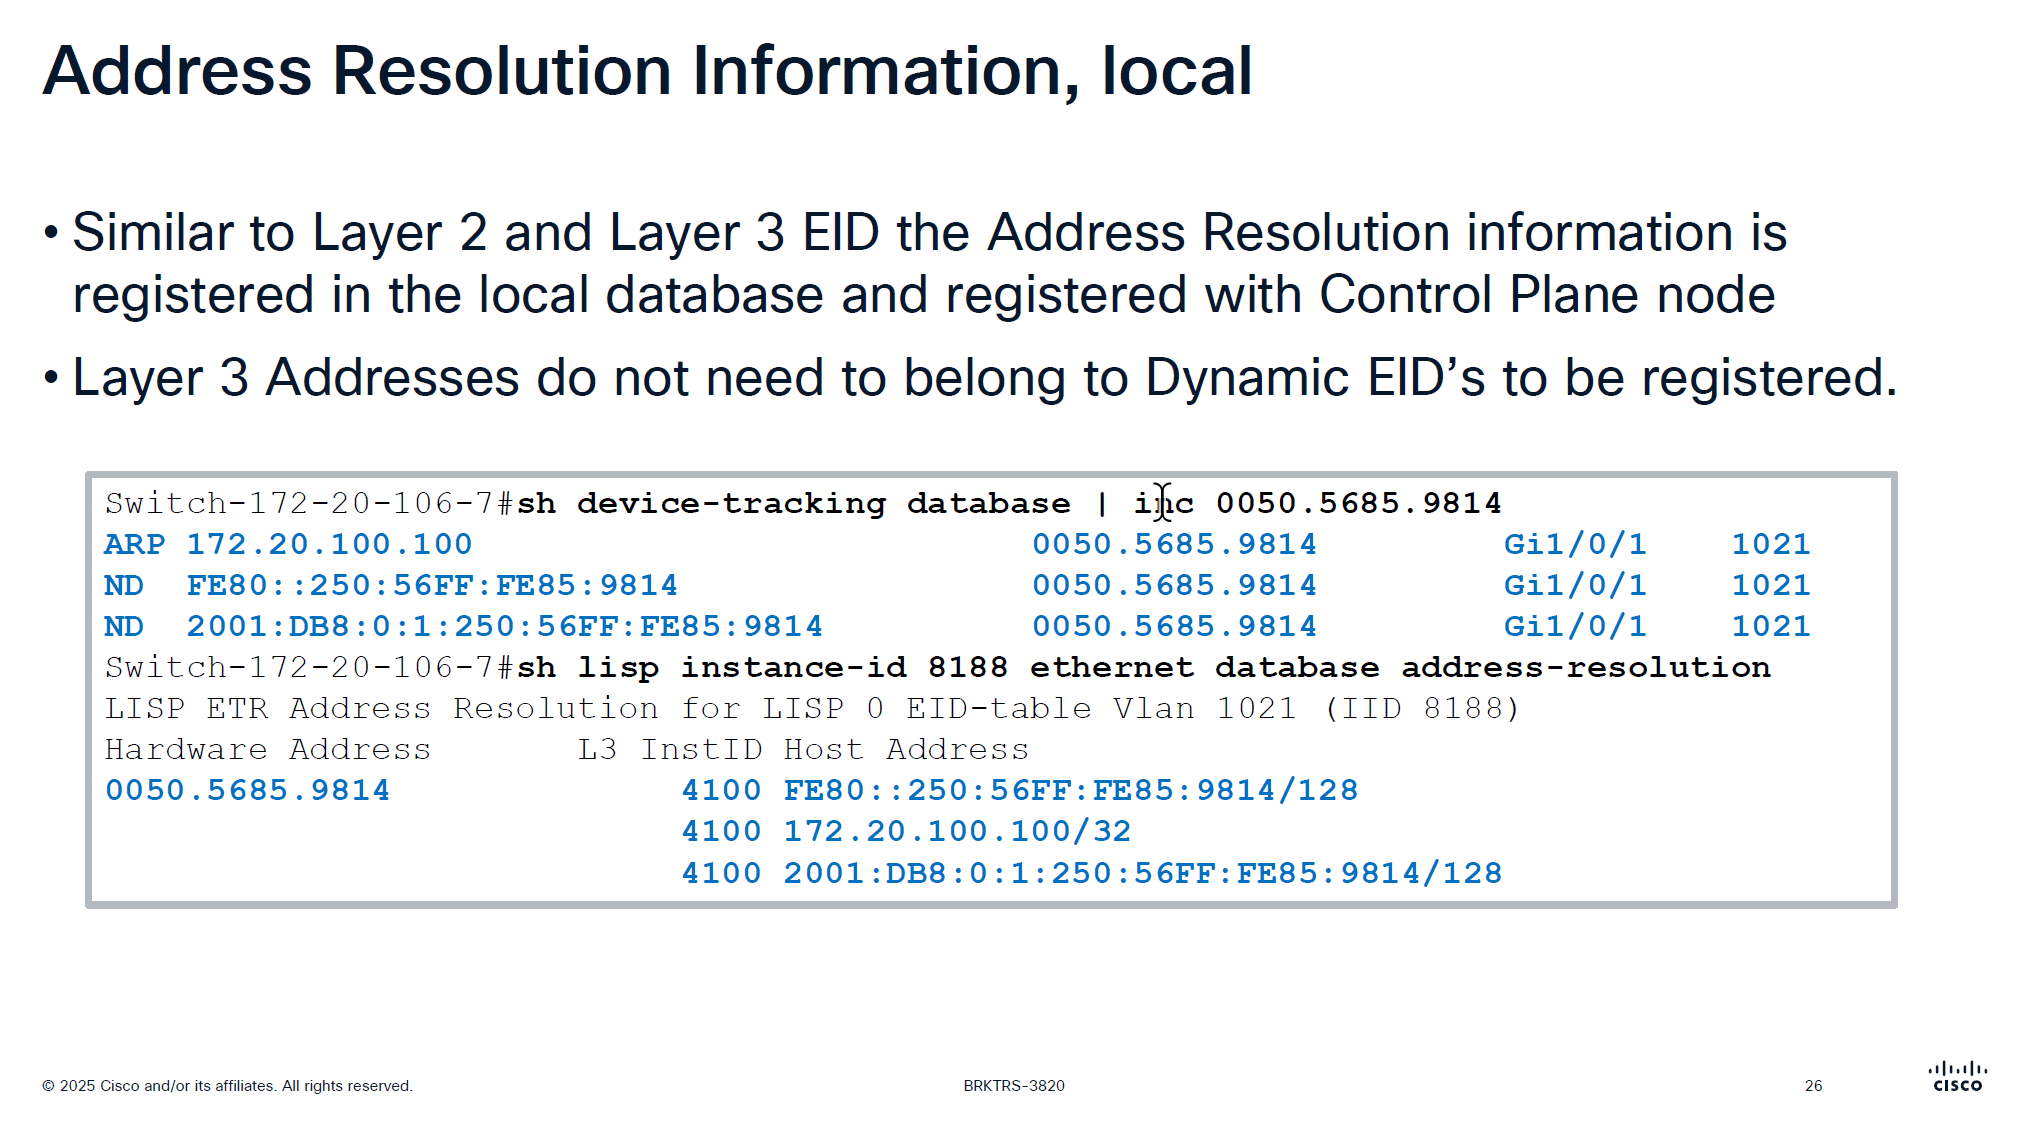
Local Database is built on the edge switch for both IPv4 instance and ethernet instance and the eid learned from local database are registered to the control plane
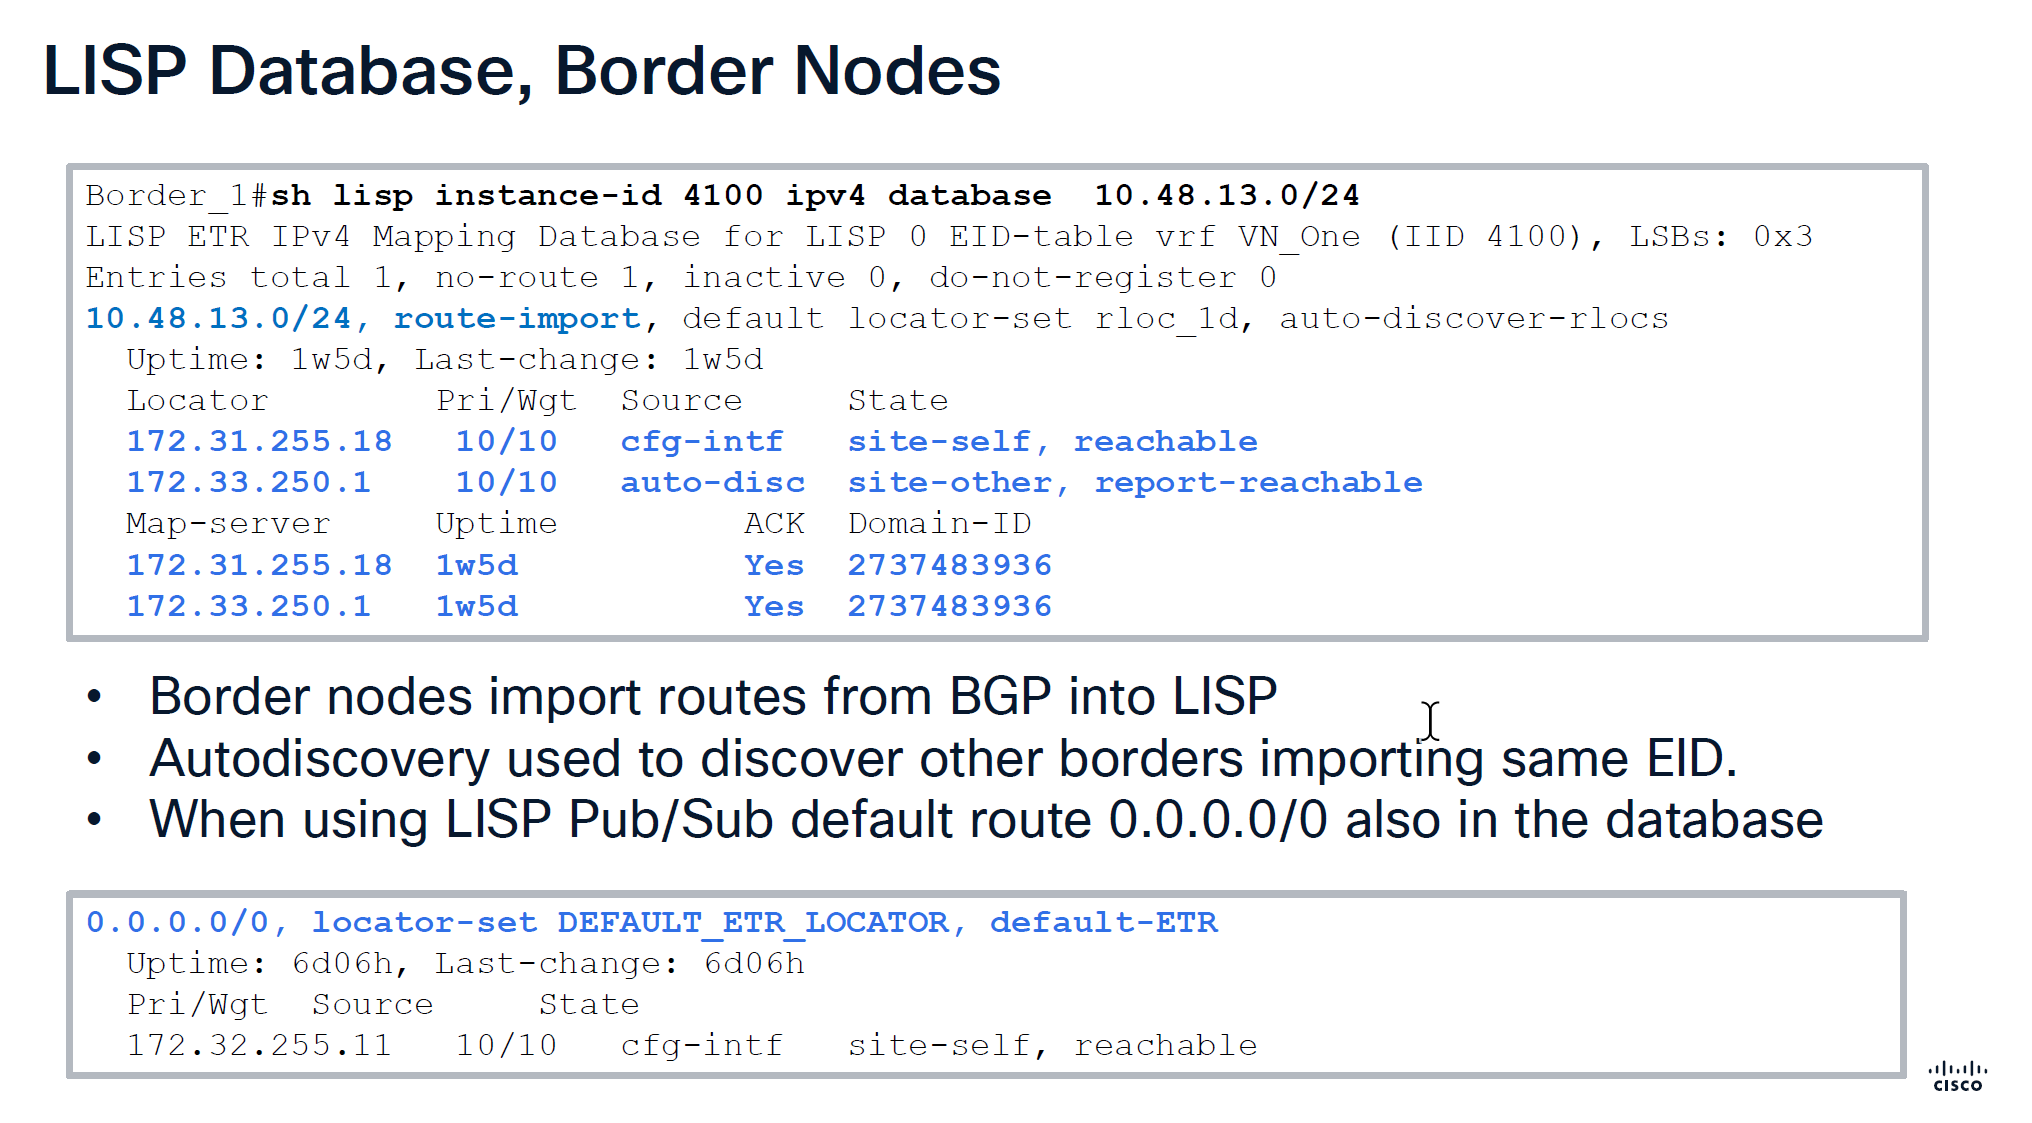
Route import tells us how it came into border node,
It then tells us about the locators it knows about
172.31.255.18 is itself marked as “cfg-intf”
and 172.33.250.1 is other border node known through “auto-disc”
Make sure that control plane has actually acknowledged
With LISP Pub/Sub comes with a ‘dynamic default border’ feature that works if we have advertisesed 0.0.0.0/0 into border per VN > then it is put into LISP database and that is how it becomes default ETR for all of the fabric
With LISP BGP we select the nodes as ‘default border’ but because there is no default route tracking or no default route, in case border node looses routes to uplink, traffic gets blackholed
With ‘dynamic default border’ if default route is not present then it will not be put into LISP and if it is not in the LISP then that device will not be used as default border
During troubleshooting with LISP pub sub, if you see fabric cannot get out and if default route is not present in LISP then that is the issue, in that case check if 0.0.0.0 is on the border node
Below we can see Map-server column having same address as border which means control and border are colocated on same node and it also shows ACK, telling us that it has registered these prefixes and sent ACK back to border saying that it has registered this prefix, if we dont see ACK then it means that there is some issue in border and control communication, either key mismatch and packets were sent to control but it was not accepted
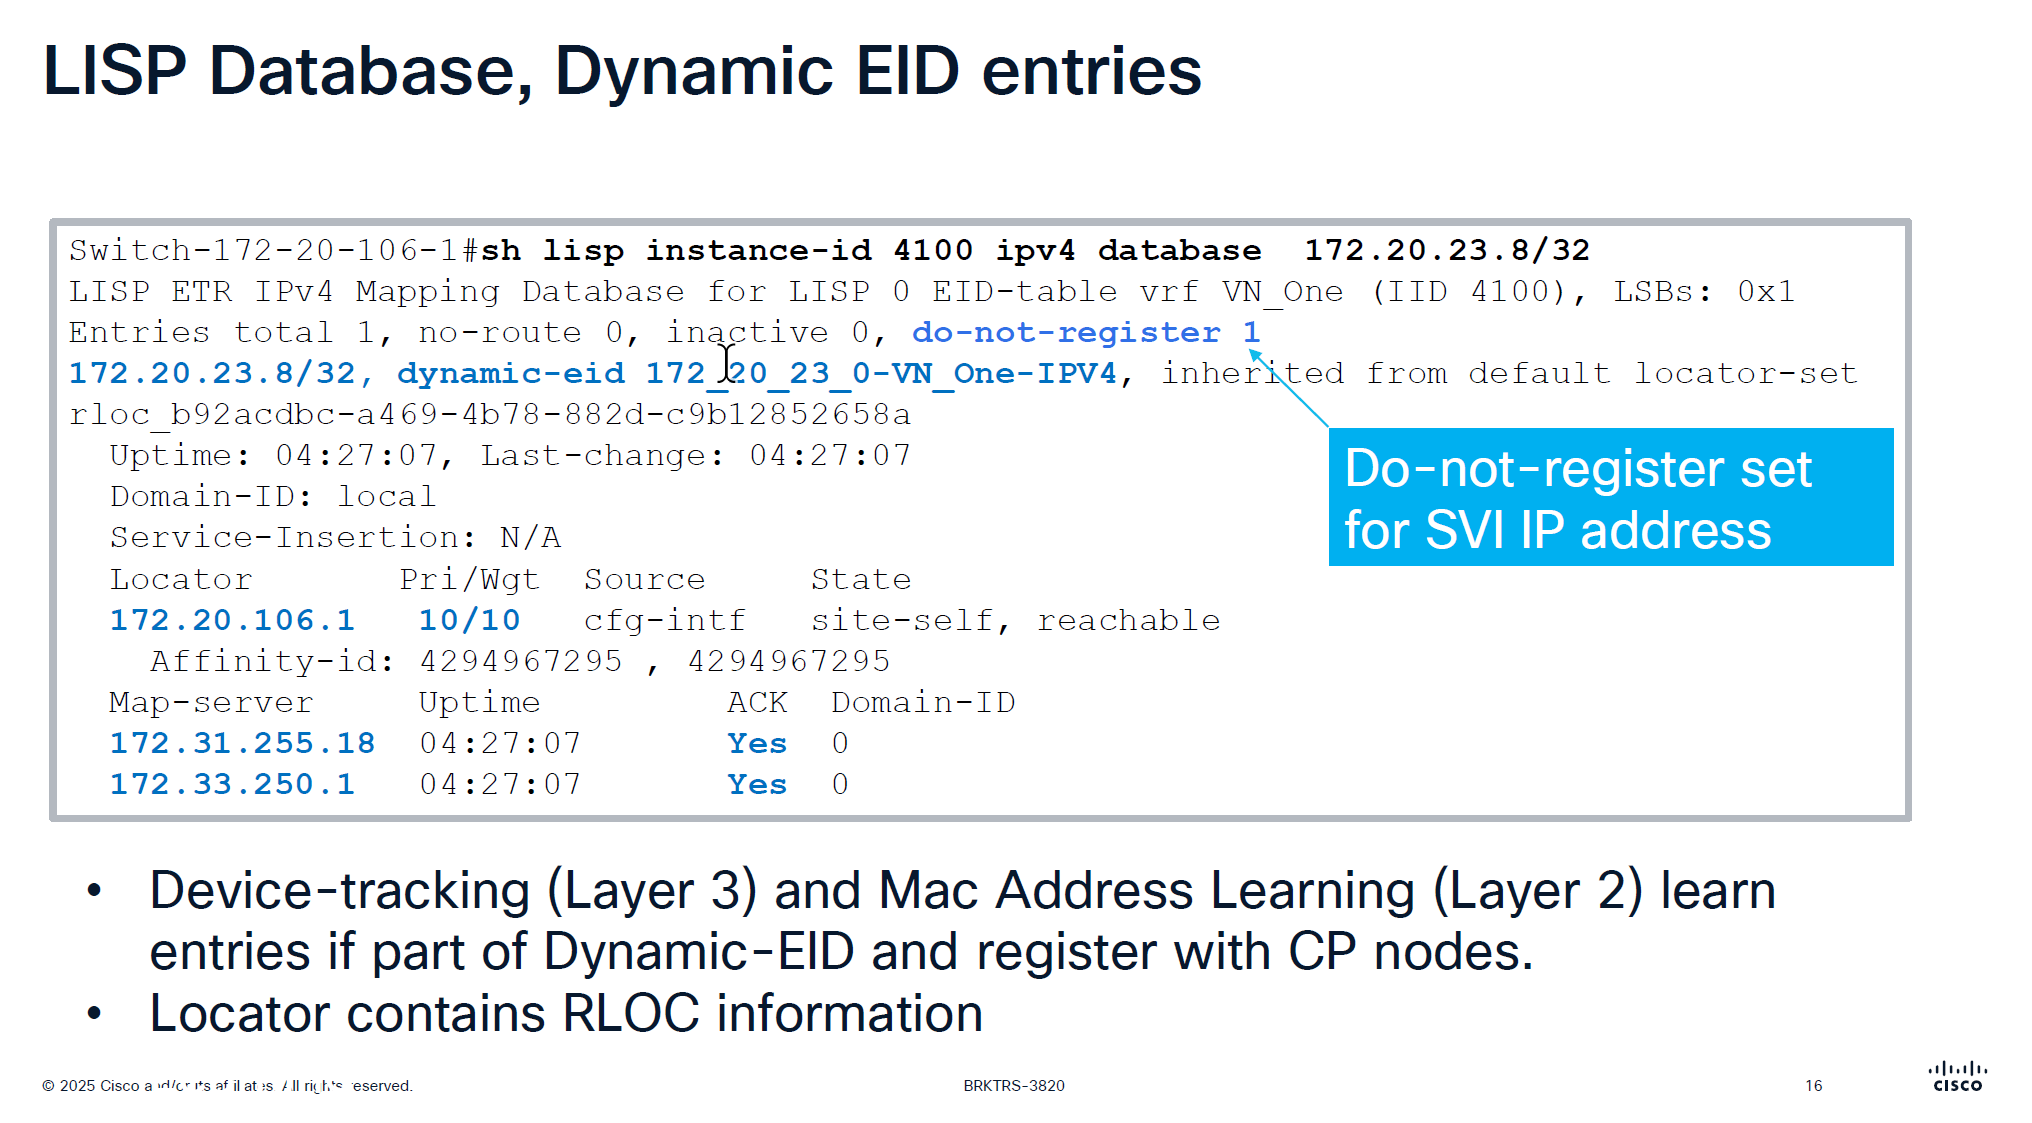
This is edge node that is saying that this endpoint EID has matched this dyanmic EID range and state is ‘site-self’ which means I regsitered it and also tells which map servers or control plane nodes it has been registered and ACK was received for the registeration
This do not register is set for SVI IP because it is anycast IP that is available on all edge nodes
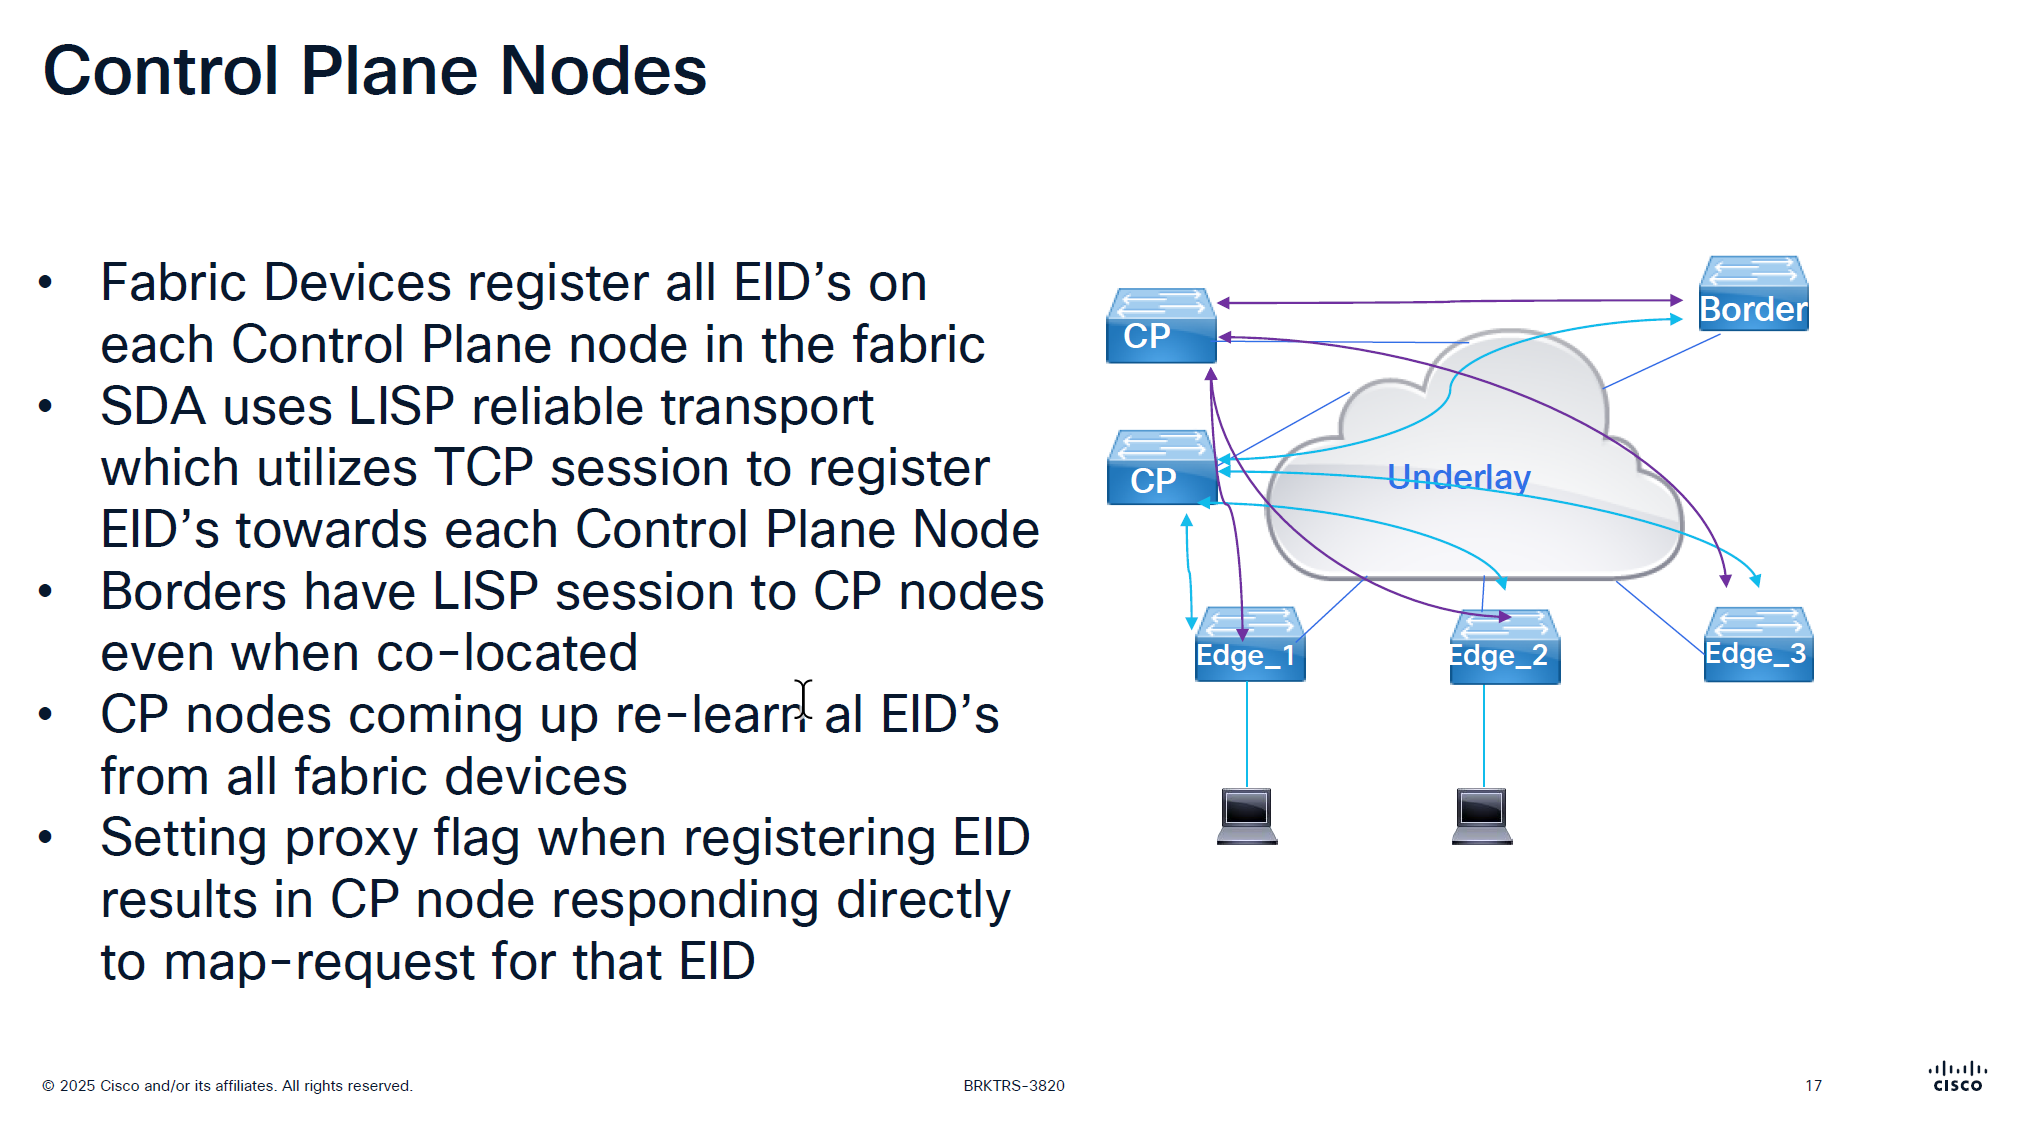
There is no communication between the control plane node, if a control plane node goes down and then comes backup then it has to relearn all the EID from all the edge nodes, CP nodes do not sync with one another , so typically when network is stable it can give the illusion that they are synced due to equal number of EID on both but CP nodes do not talk to one another
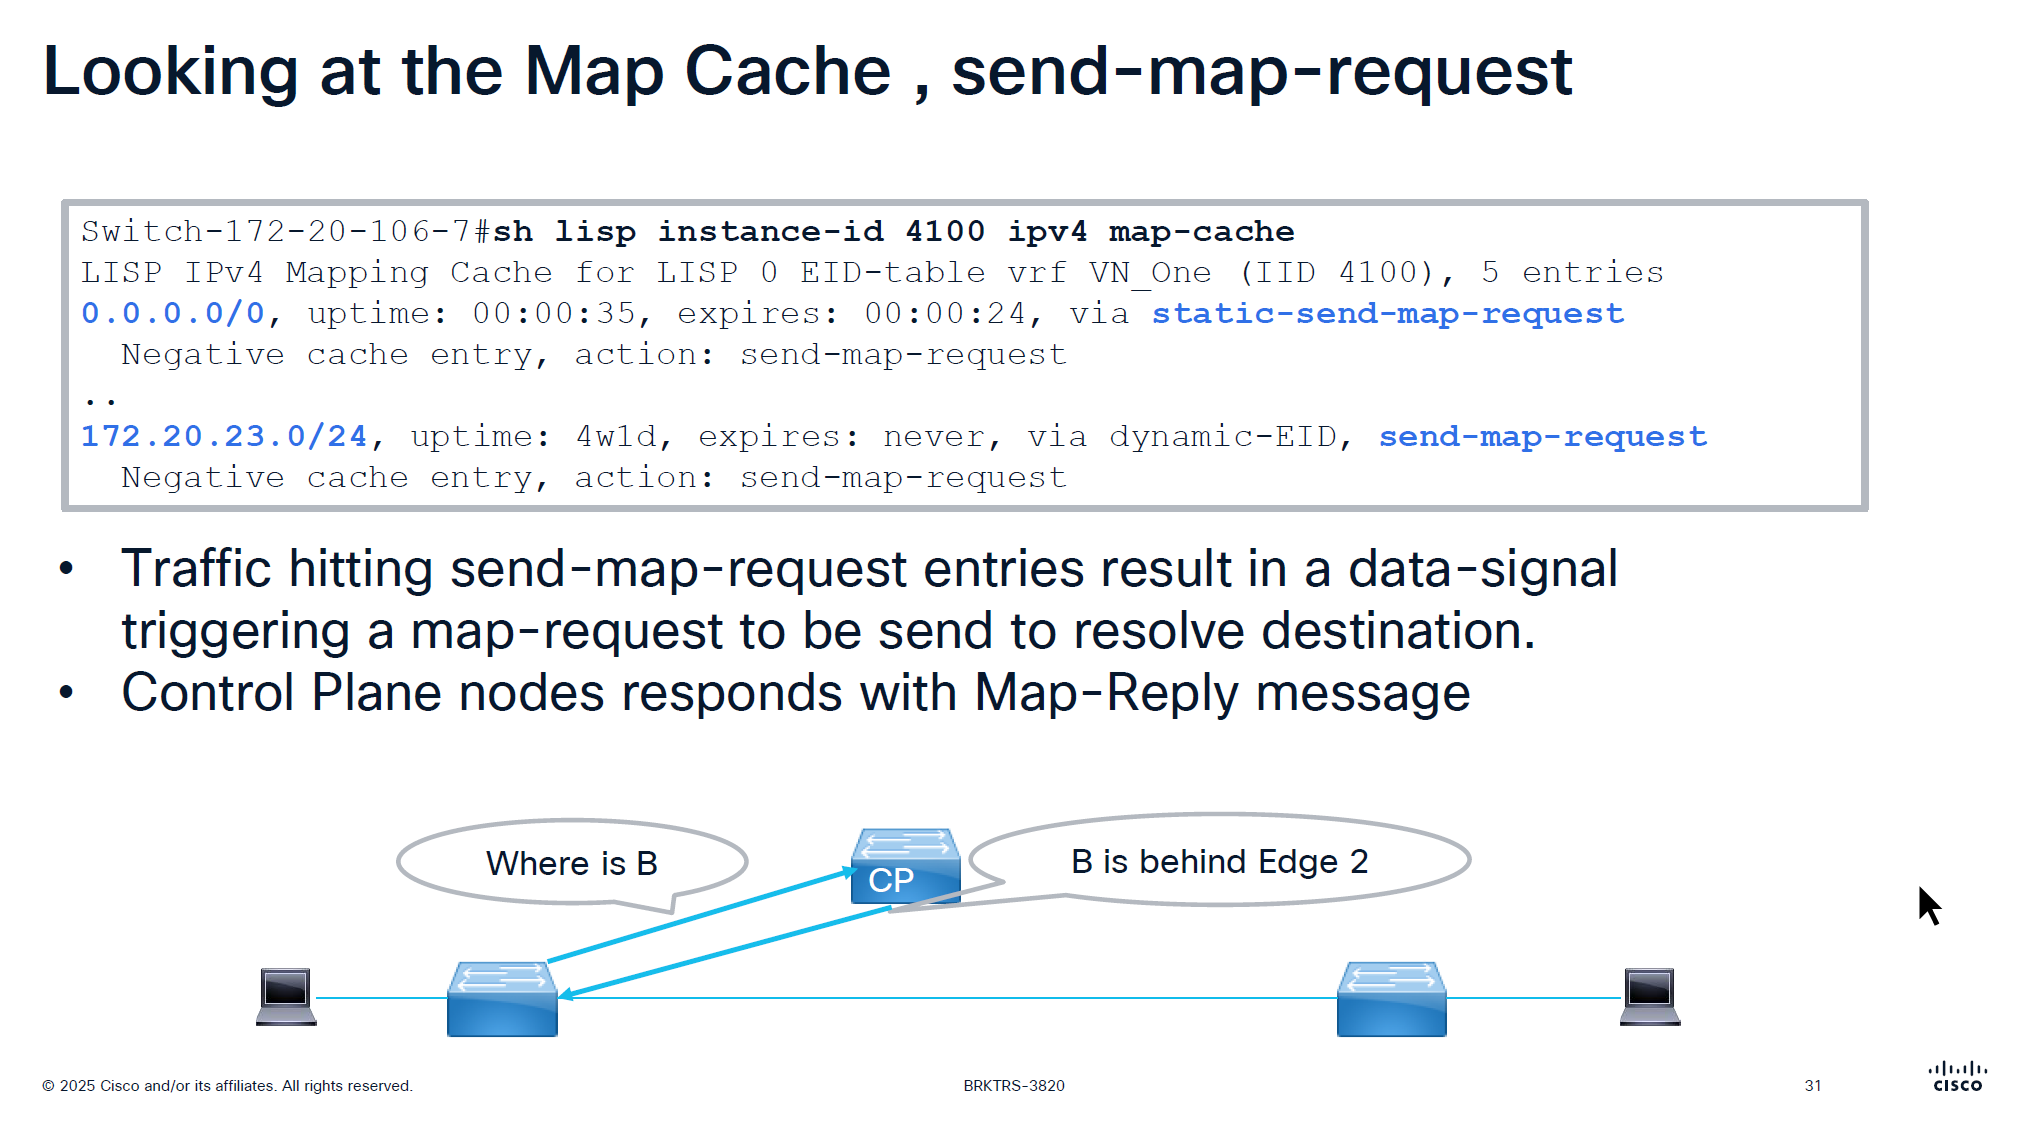
map request and map reply
map request is not a request to map an entry or register but it is a query to get a reply from control plane node
Last point is saying that in traditional LISP, Map server only responds to the edge that registered the endpoint, but in SDA version of LISP, map server responds to query from anyone by setting the proxy flag on registration time
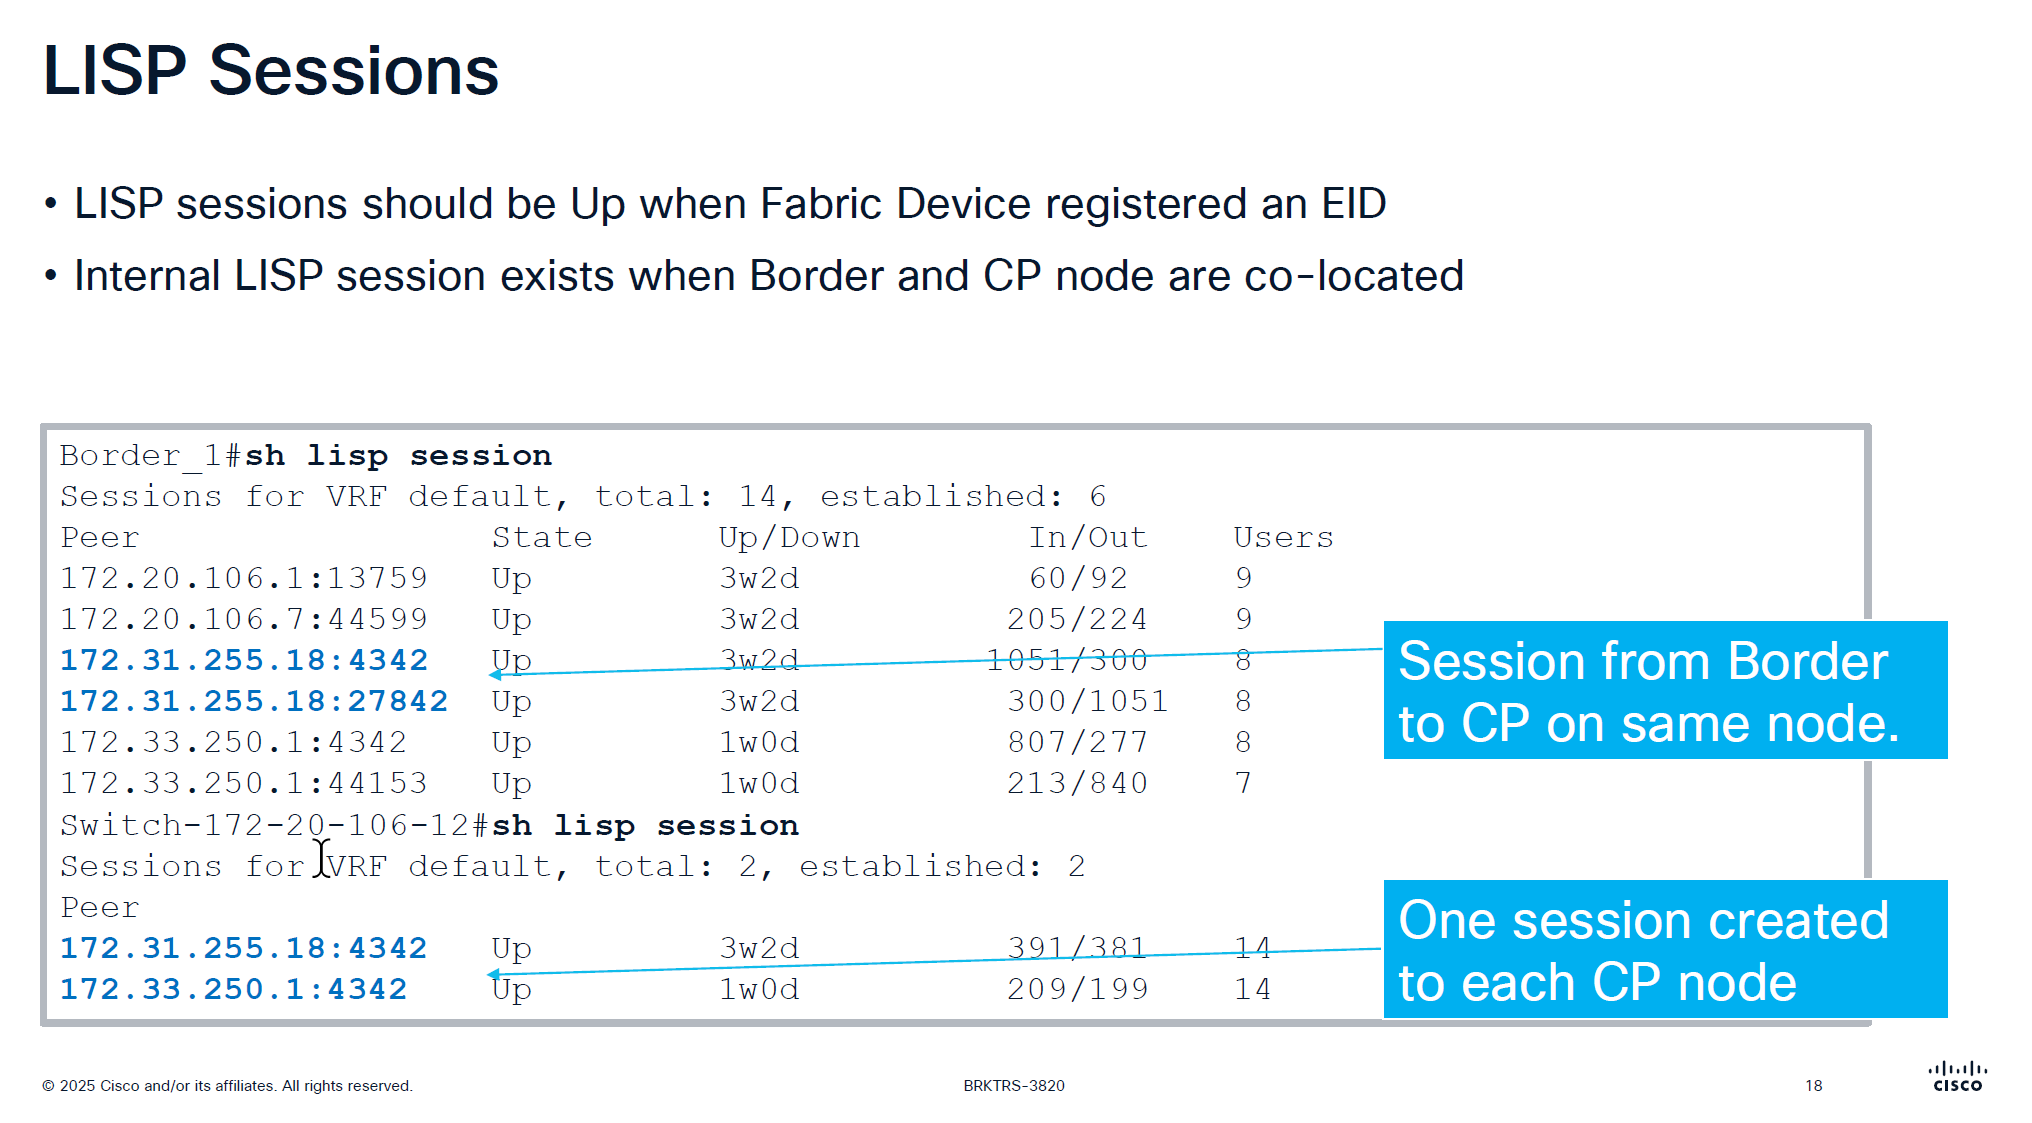
CP and border still make connections to one another if they are colocated on same box
So in LISP sessions you will see it establishing LISP sessions from itself to itself
On the edge node you will see LISP sessions based on number of control plane nodes you have
Users column is not actual user but how many instance IDs are using it
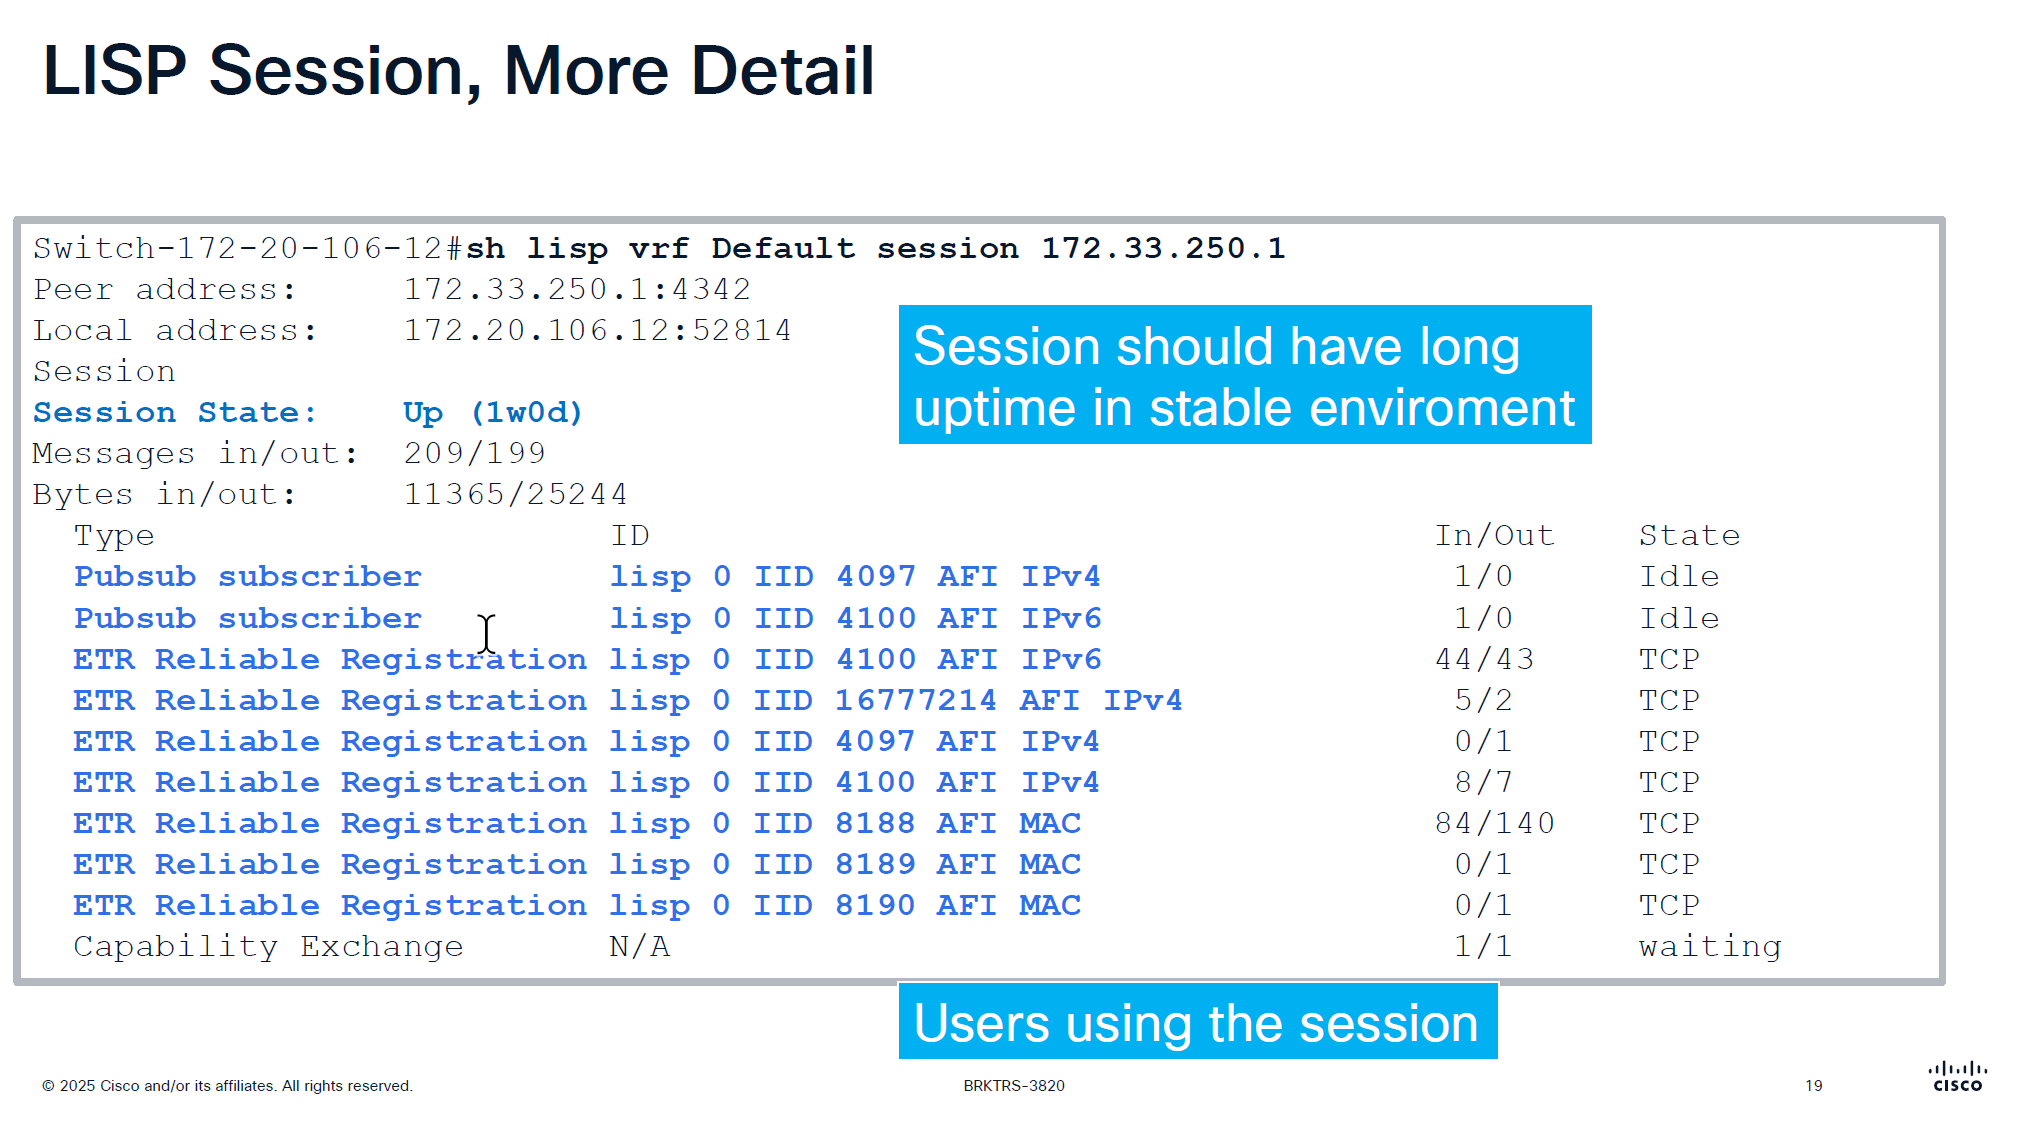
Checking detailed command shows us the LISP instances using the LISP session
make sure that your session up time is big and if it is small then it indicates some sort of network instability and network issues
This command actually shows us that there are LISP instances exchanging information with Control plane node and not just TCP session on port 4342 that is up
That message at the bottom that is “Capability Echange” means that there is a session trying to establish but there is something wrong like key exchange and state is also in “waiting”
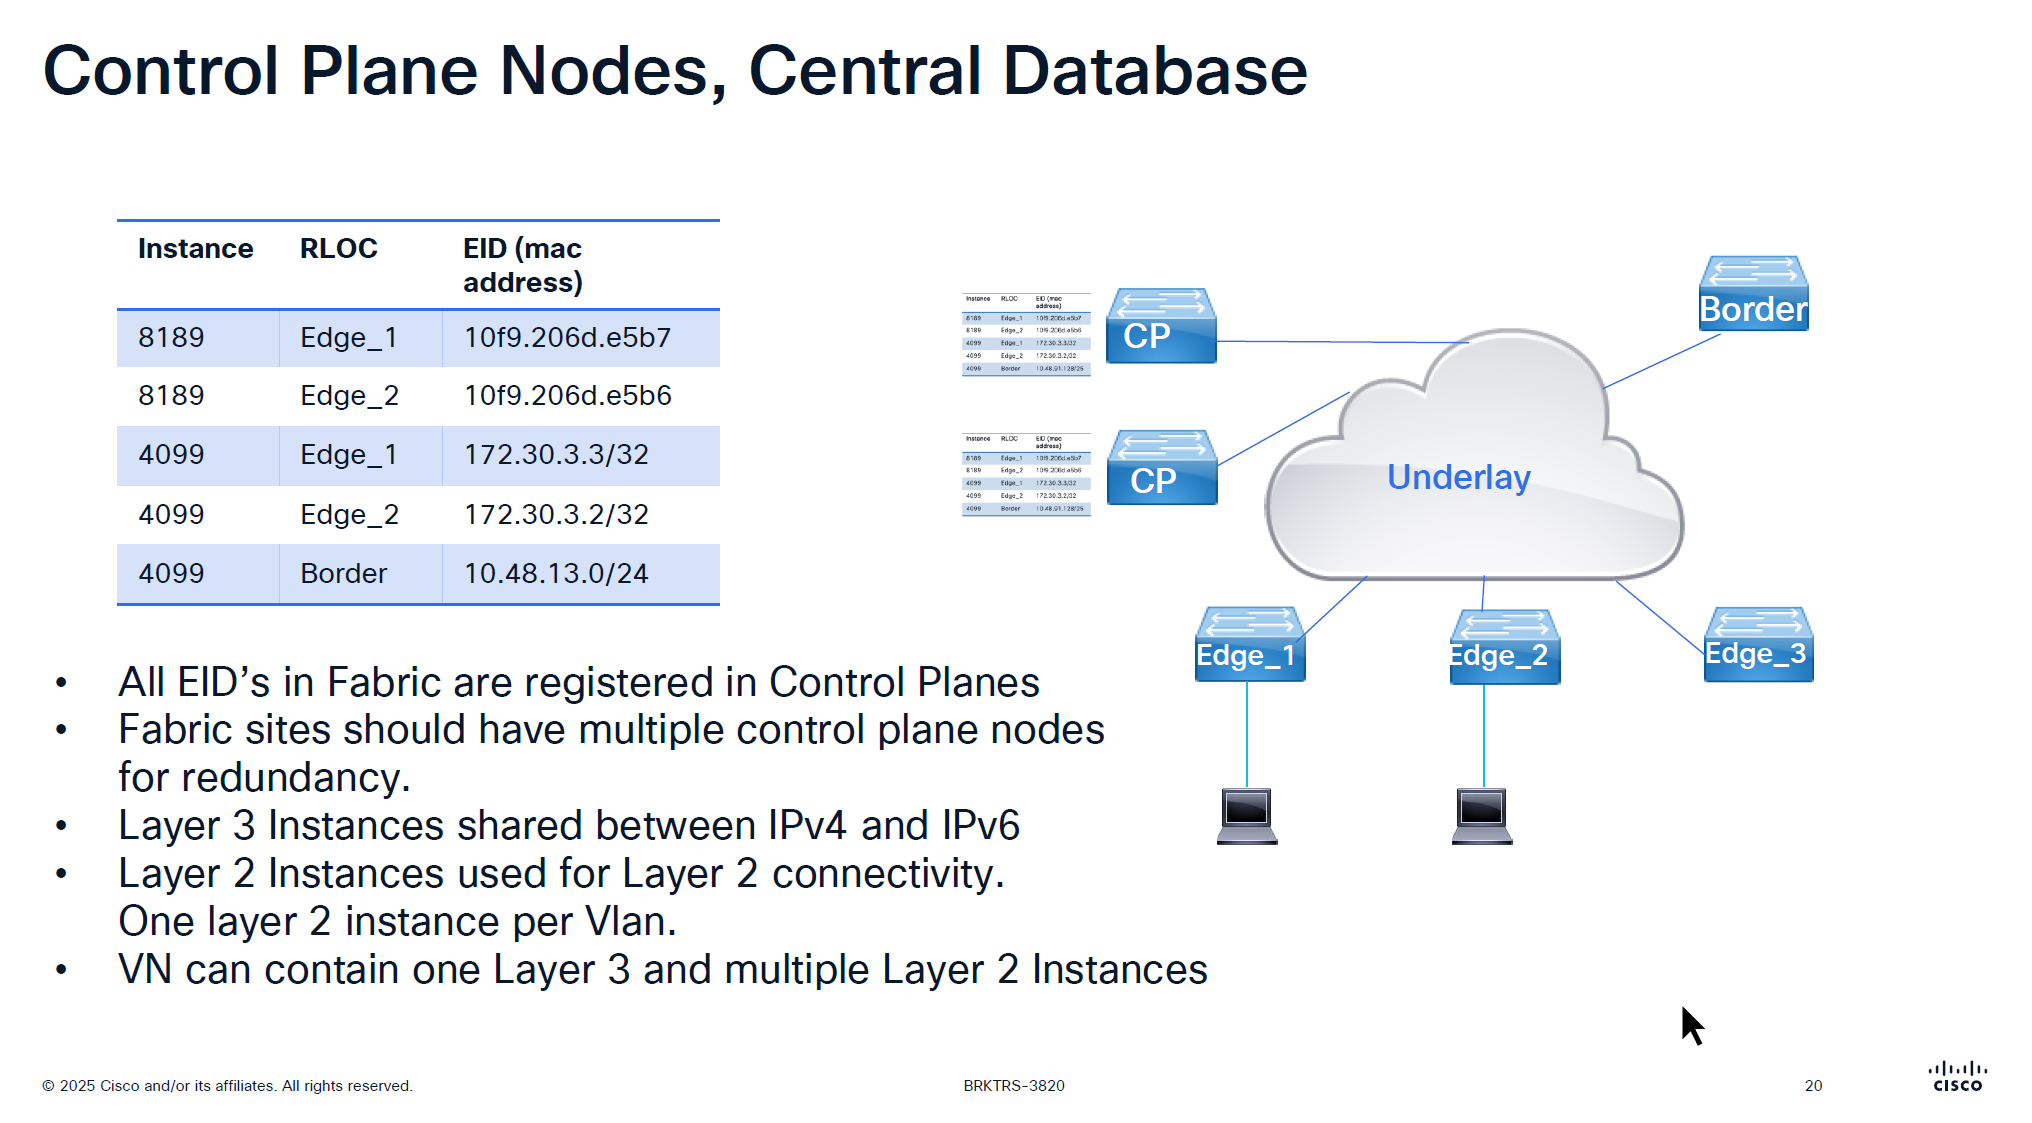
For IPv4 the instance ID start from 4097 and up
for Ethernet instance ID it starts from 8189 and layer 2 instances are used for Layer 2 connectivity and it creates one layer 2 instances per vlan
One VN is one Layer 3 instance and multiple Layer 2 instances
If there are 2 devices in one IP pool across different edges then they will use Layer 2 instance
if 2 devices are on different IP pool or 2 different subnets then they will speak using Layer 3 instance
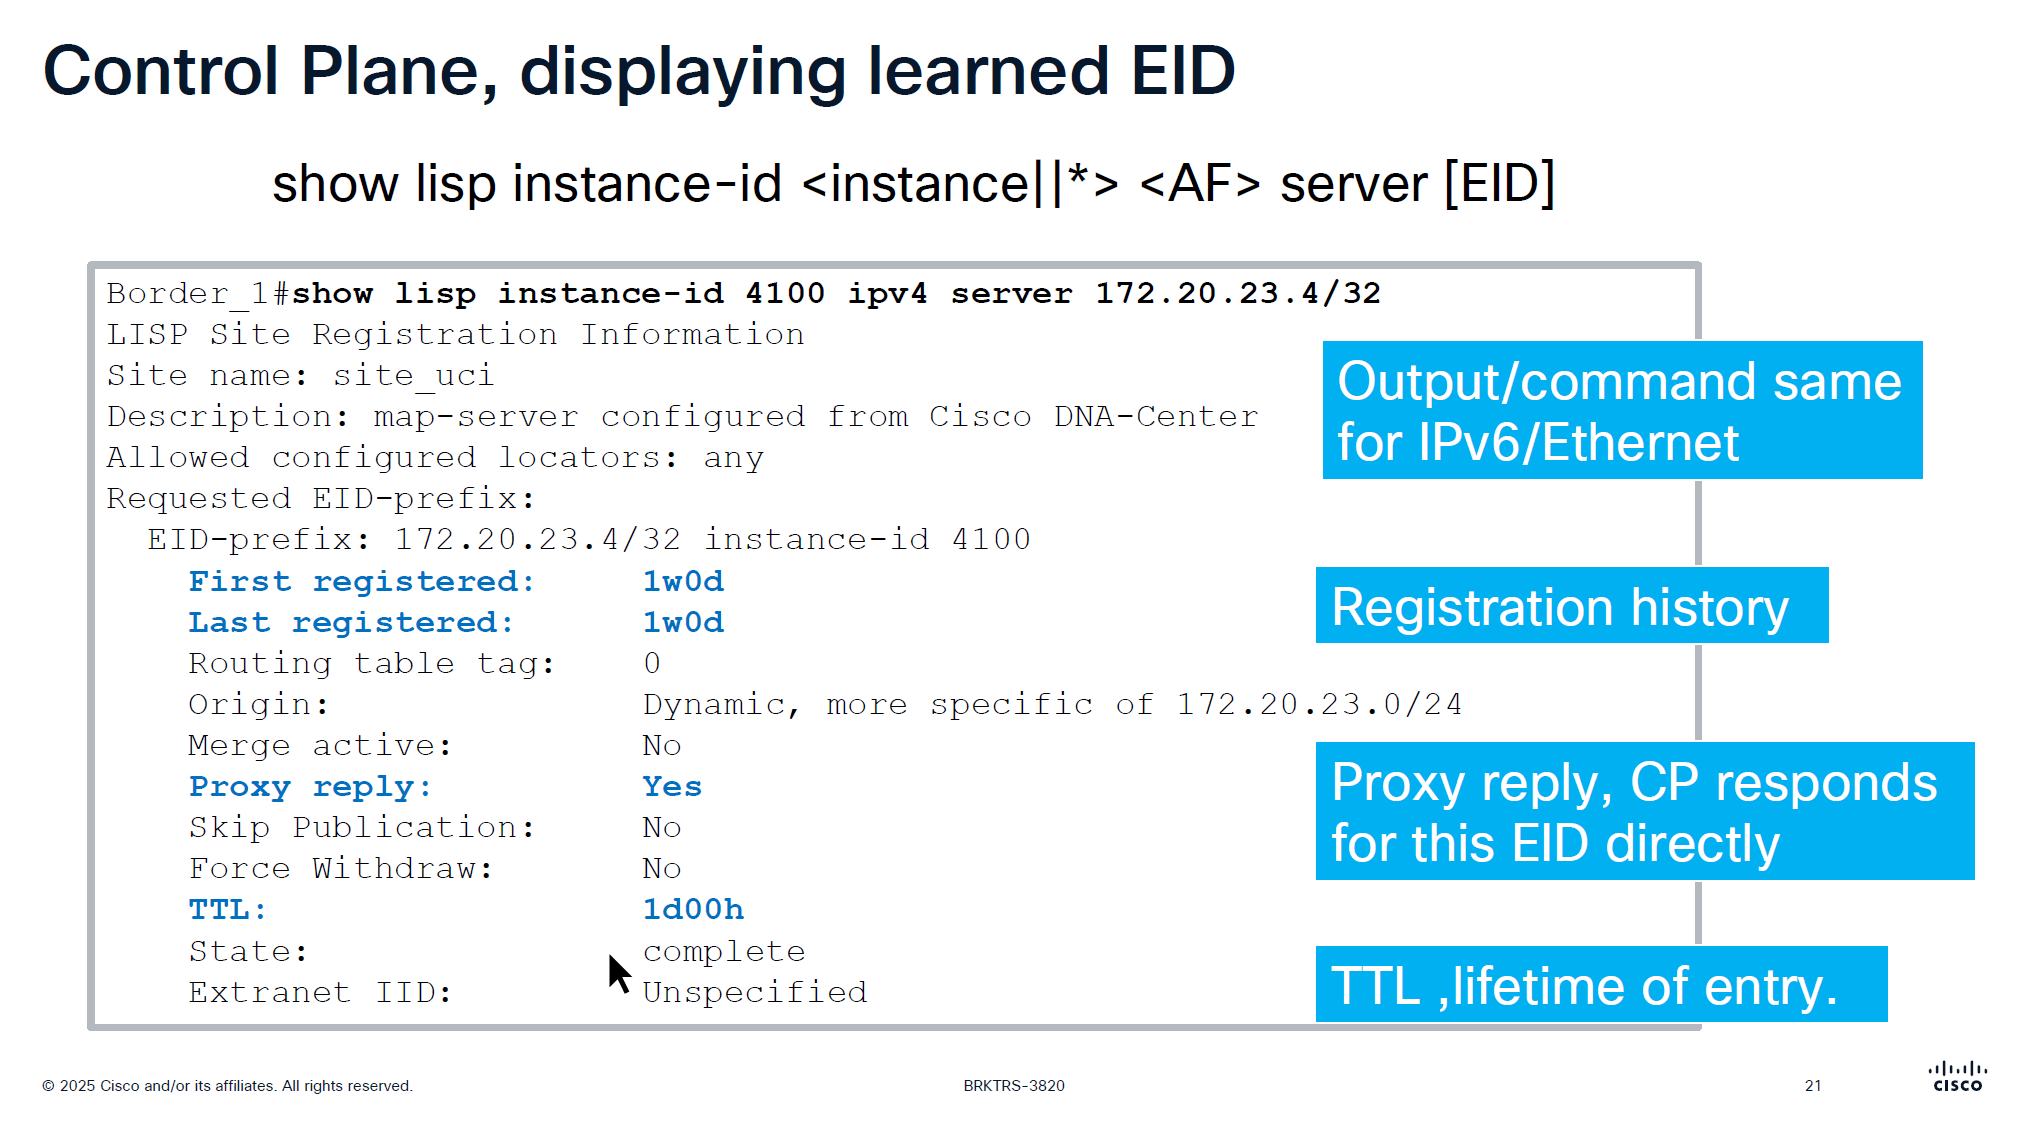
When you see “server” keyword that means we are asking control plane node
This is imporant command to troubleshoot endpoint and LISP registration, it shows when it first registered and when it last regsitered
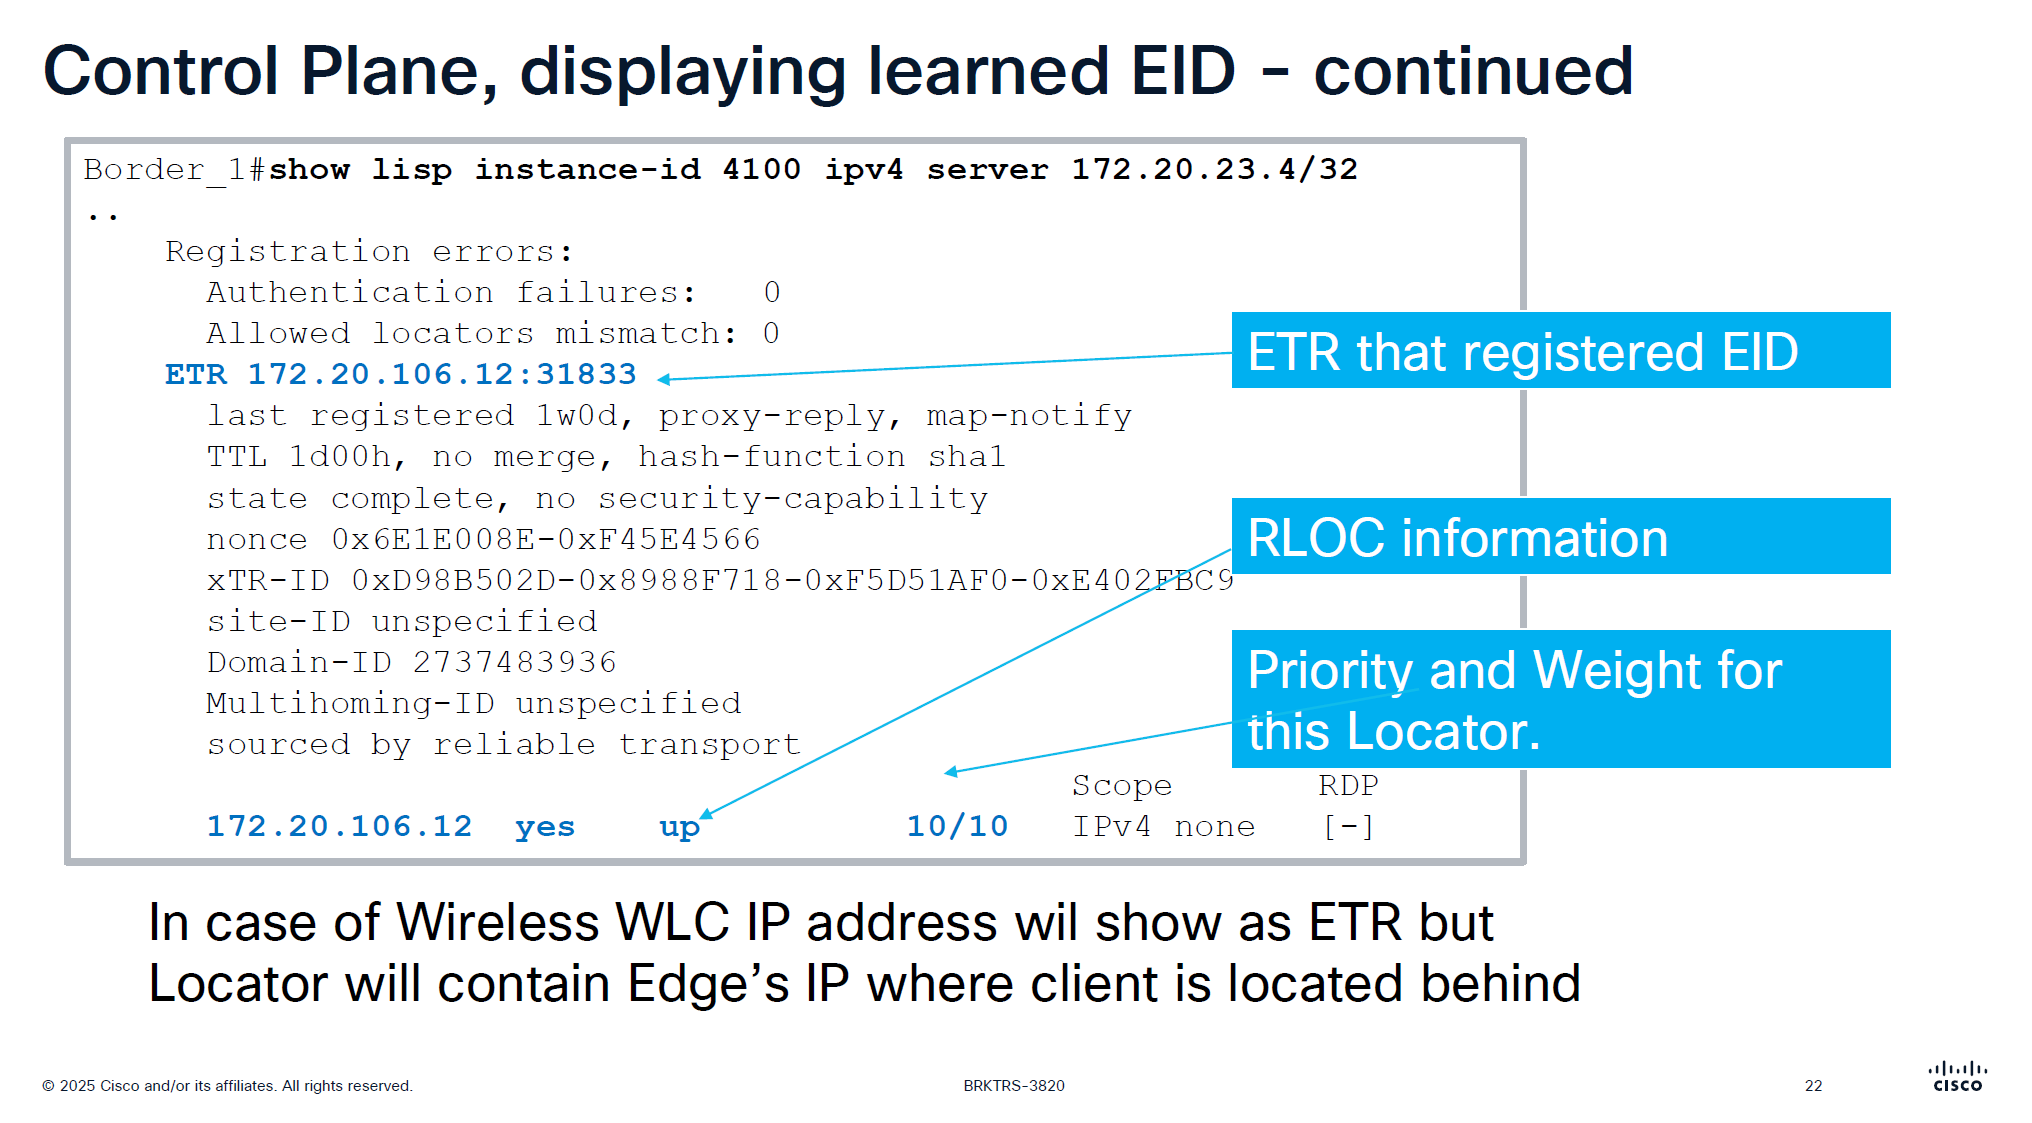
This is output from border node and it is showing ETR as edge node behind which this endpoint lives
only server command will show us last registering ETR
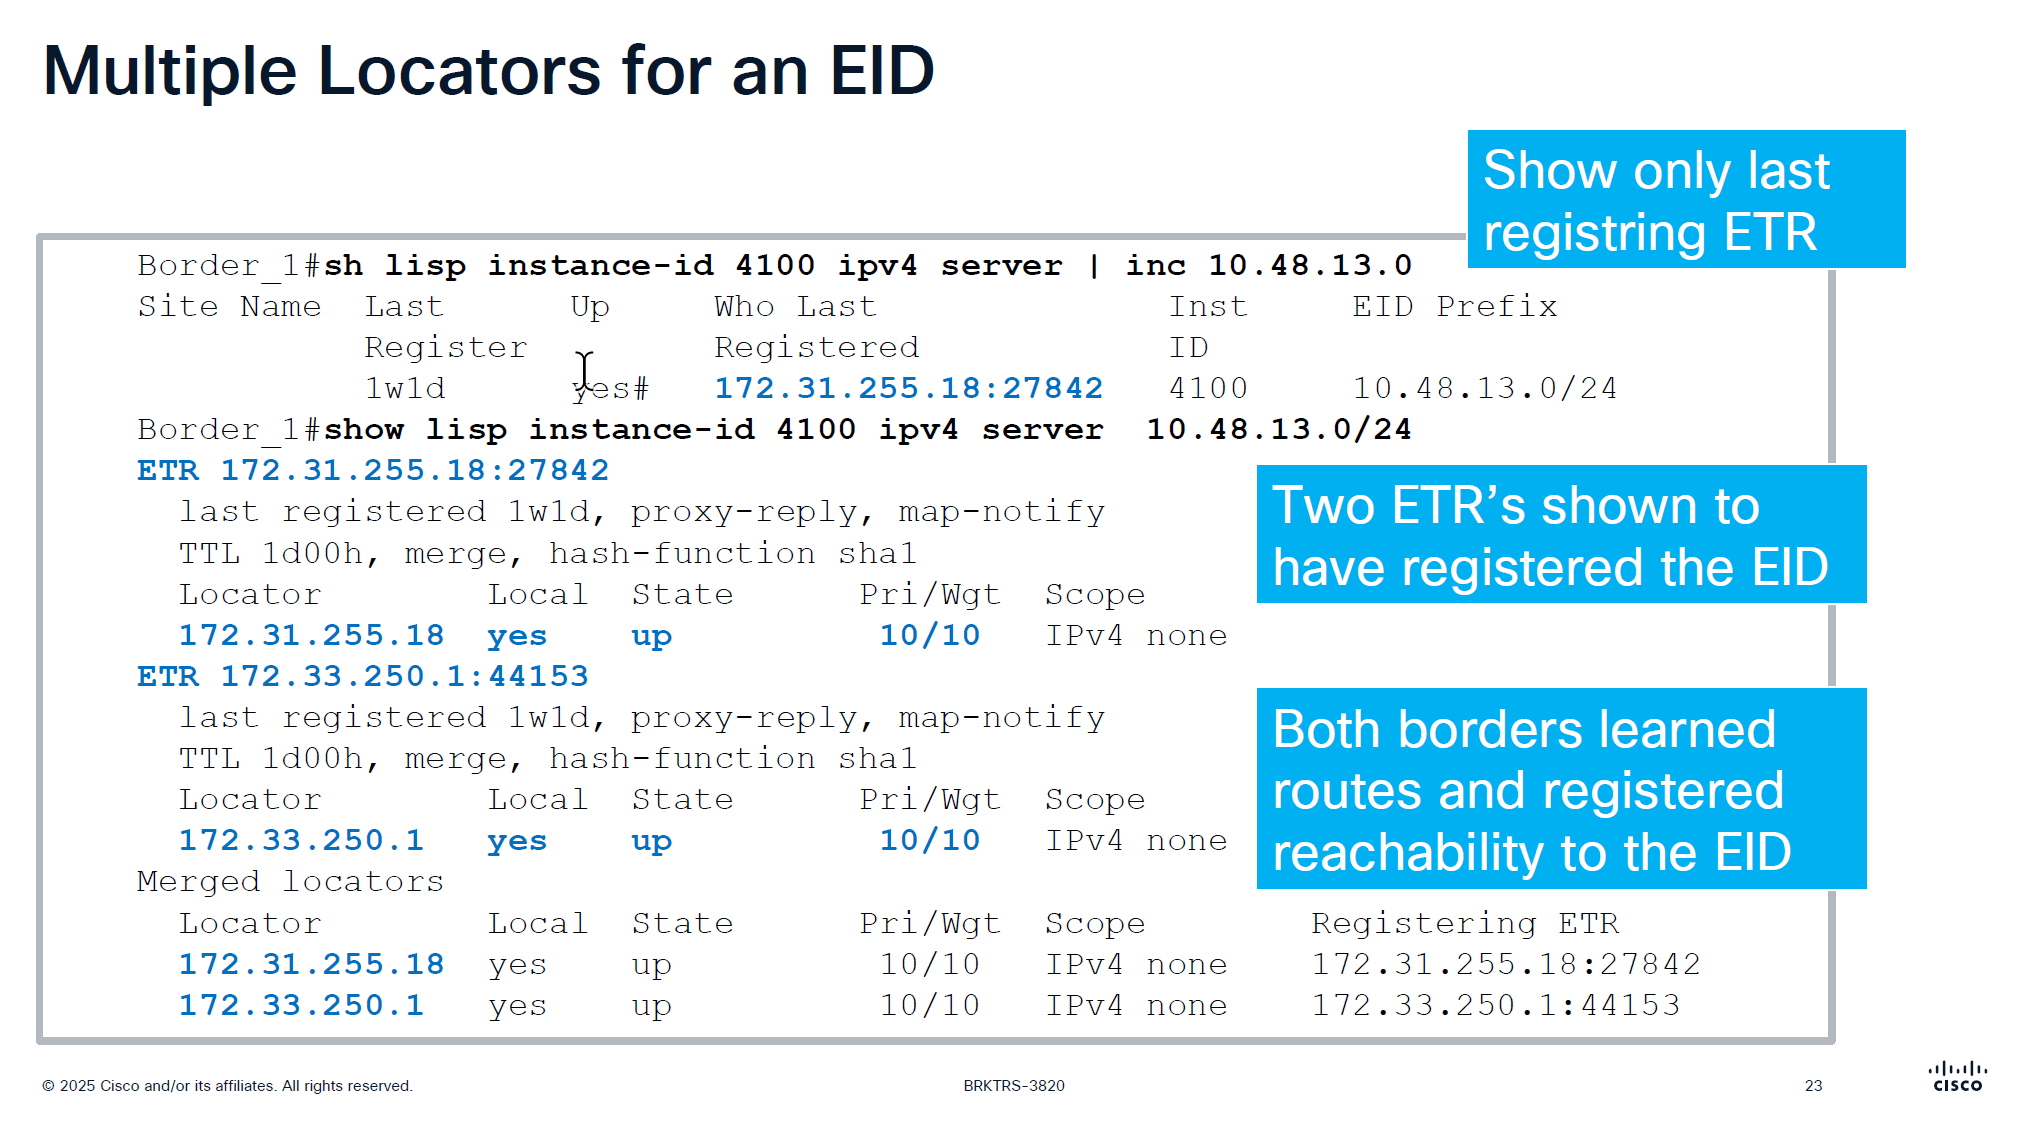
server command with prefix will show us the ETRs (borders) that are registering that prefix and notice that because of priority/weight of 10/10
LISP priority uses lowest priority number as preferred
If RLOC1 has Priority 1 and RLOC2 has Priority 10, all traffic goes to RLOC1 (Active/Standby)
if both RLOC have priority of 10, then it means both routes will be used in loadbalancing fashion then weights are considered, how much traffic will be sent if priorities are same
If both RLOCs have the same priority (e.g., 10), they are considered equal, and traffic is distributed based on weight.
Weight is used for traffic engineering when multiple paths have the same priority.
It specifies the percentage of traffic a particular RLOC should receive relative to other RLOCs in the same priority group.
If weight is set to 0 on an RLOC then no traffic is load balanced to it, unless it is the last one left
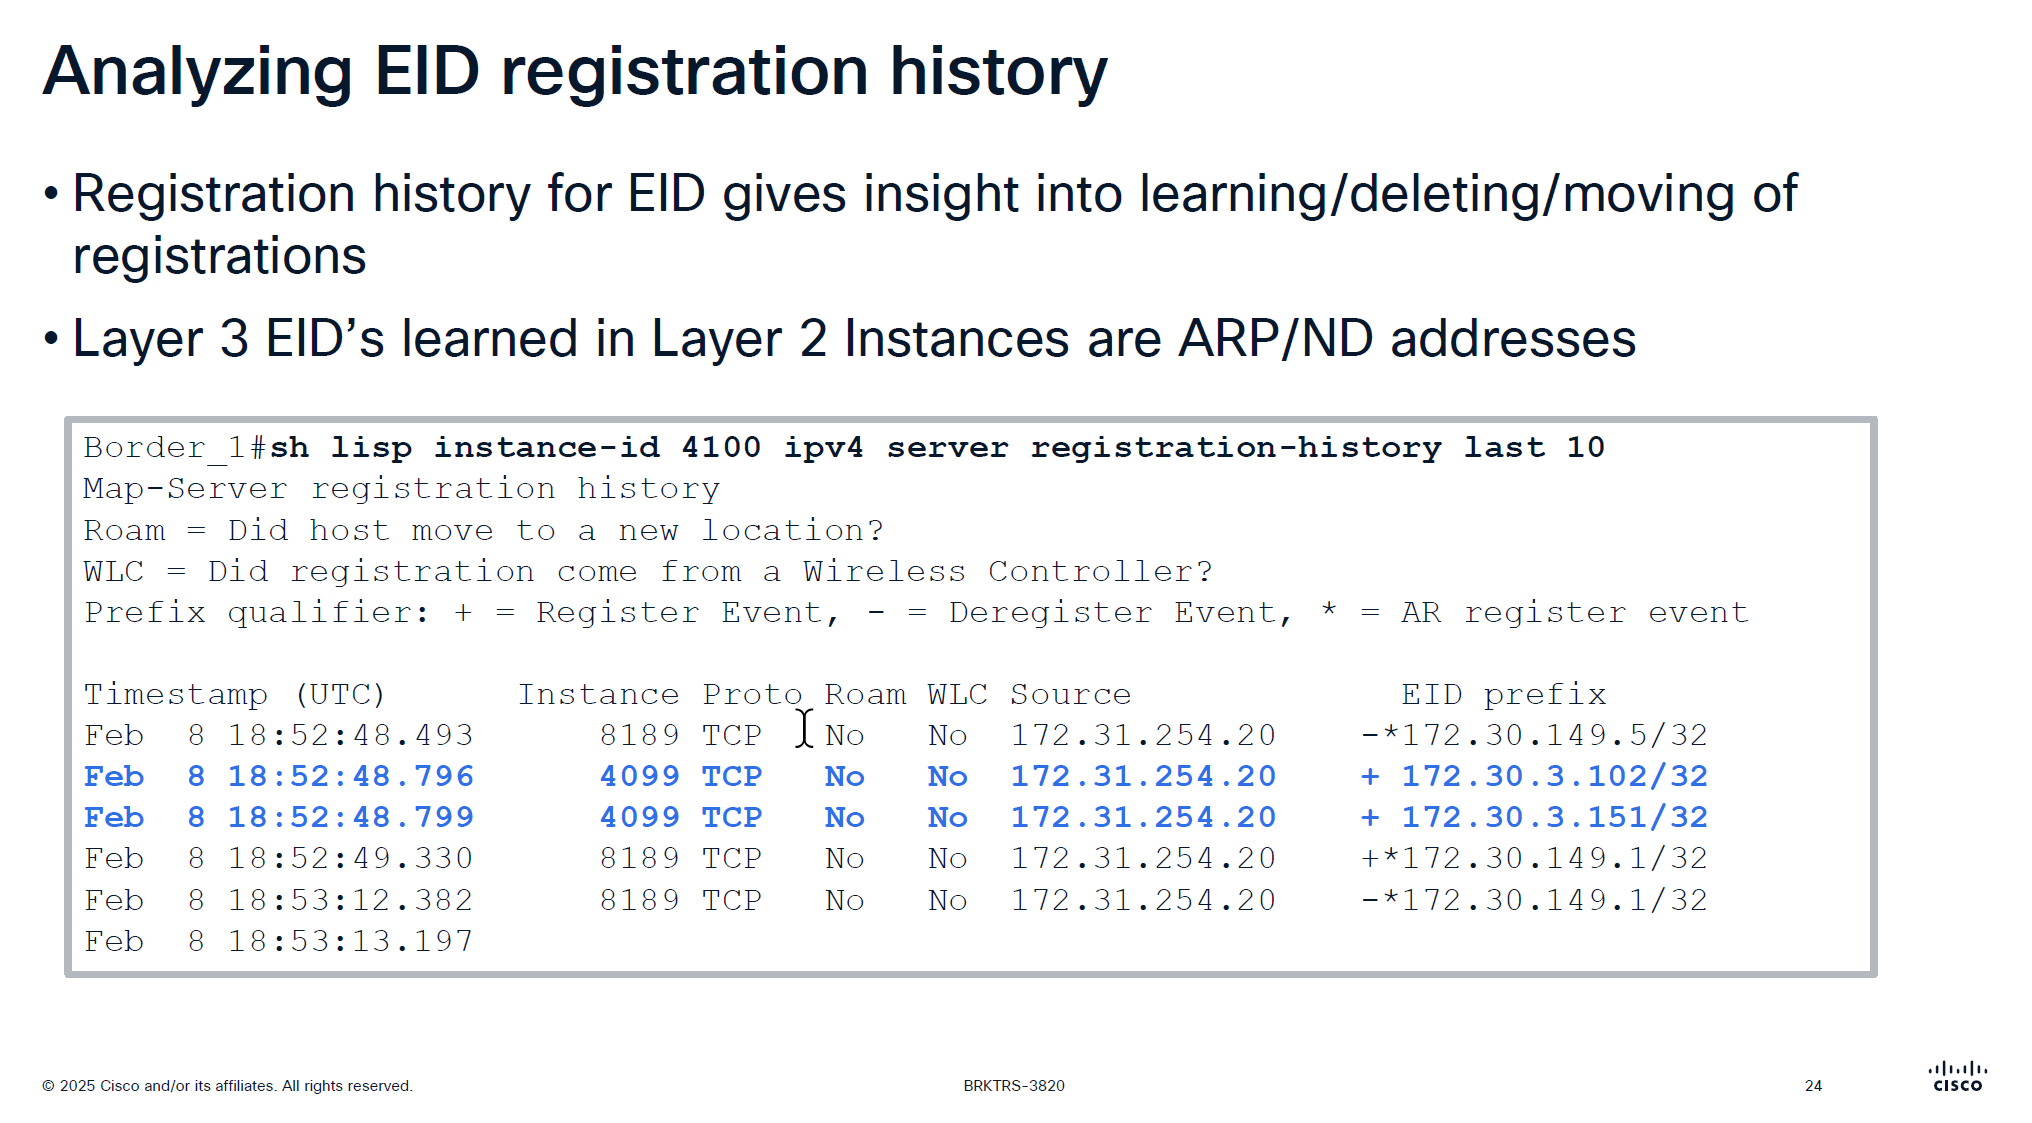
Very important command for troubleshooting for a client, may be it got disconnected or roamed or what not
Notice that first entry that is L3 /32 address being registered inside Layer 2 instance that is ARP regsitration and not the real registration that is also regsitered inside Layer 2 instances
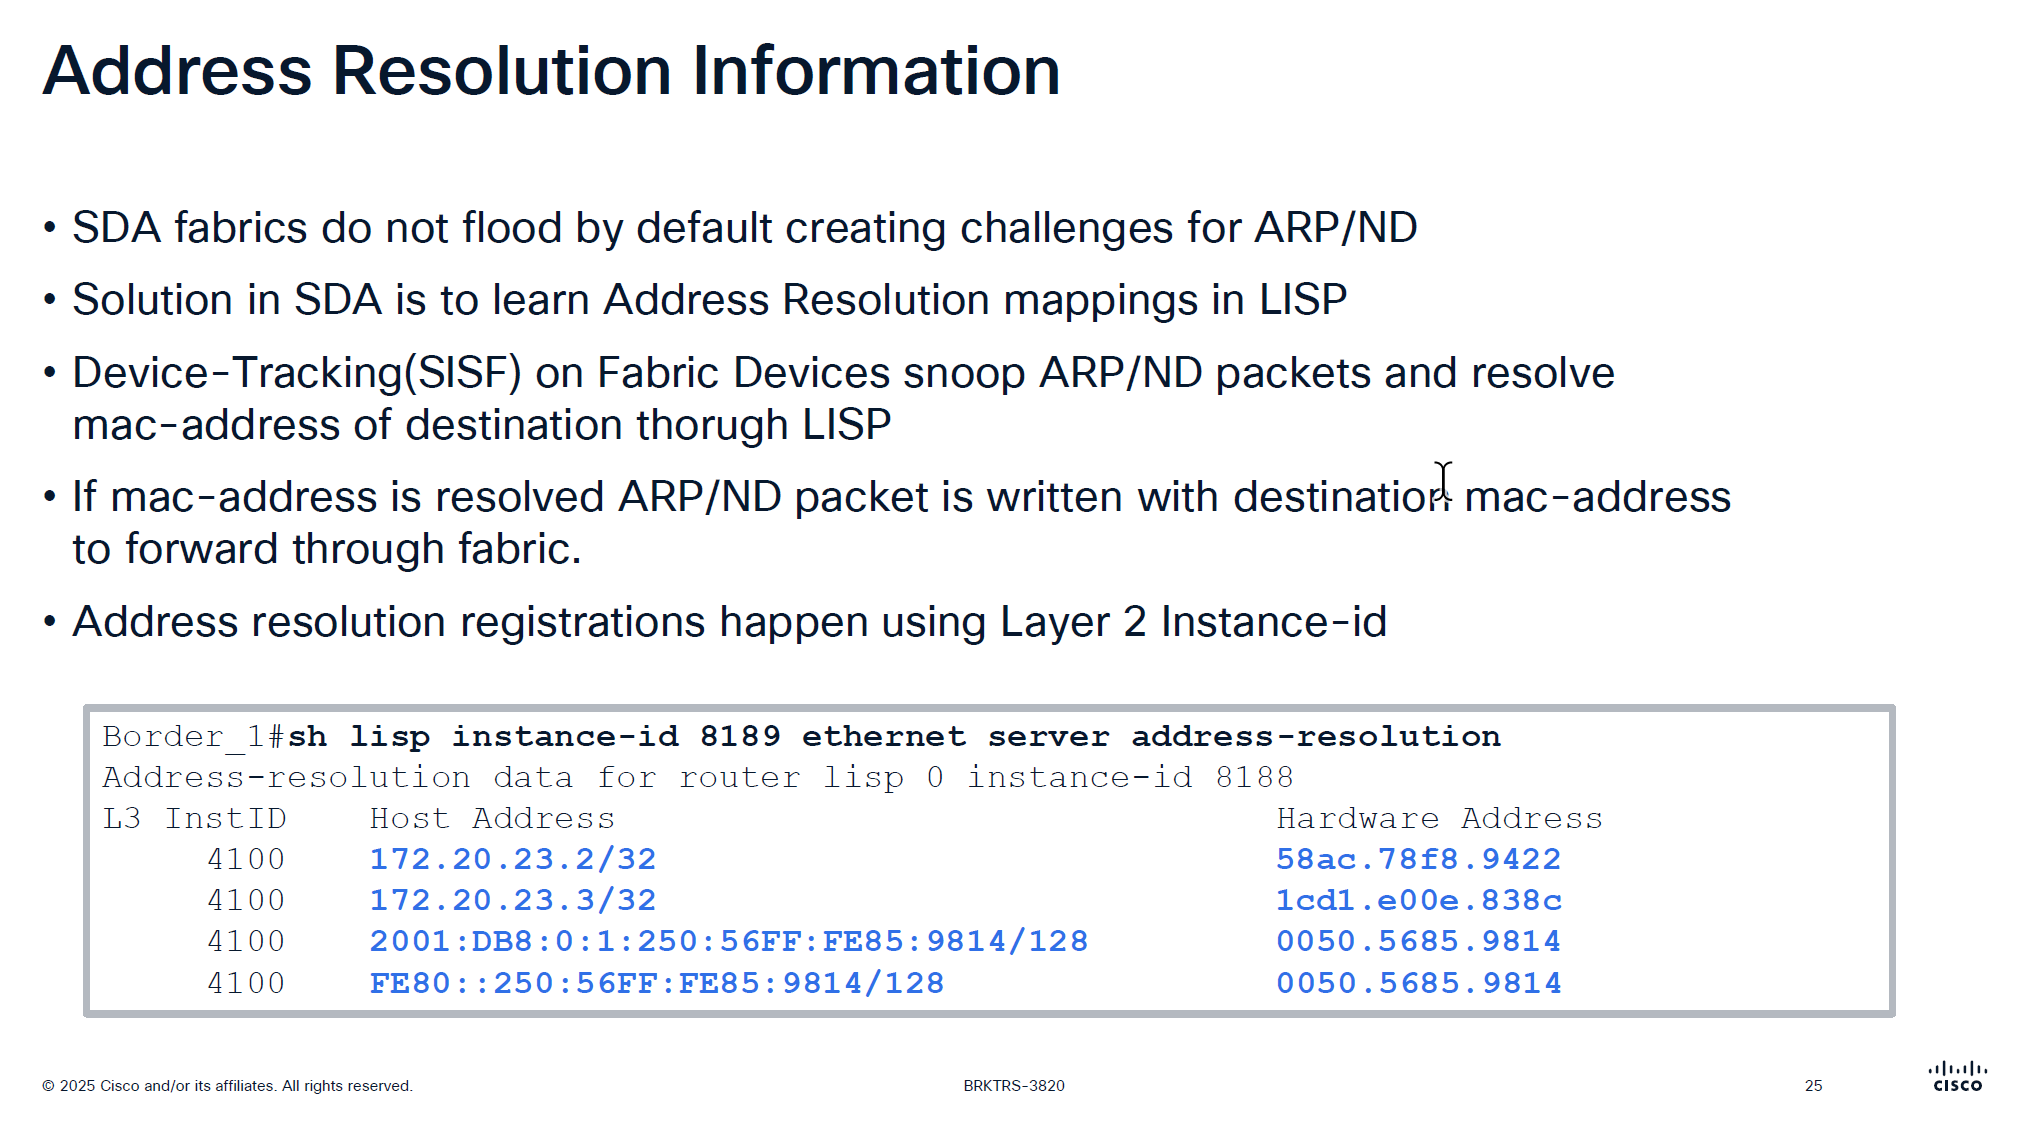
Above command is “server address-resolution” on “Layer 2 instance” on “control node”
Due to VXLAN we can only unicast the packets and broadcasting is not supported unless flooding is enabled on the VLAN but for ARP to specifically work there is a special support in order to get the ARP working, switches snoop the ARP packets for destination inside the ARP message but dont actually flood them yet
LISP then asks for control pane for that destination IP from ARP and control responds with layer 2 mac address corresponding to that L3 address (from device tracking)
then LISP simply rewrites or replaces the broadcast address with the MAC address it received from control plane
this ARP packet is now able to be sent over the unicast over the VXLAN tunnel using Layer 2 instance
This is why silent devices are hard to troubleshoot and do not work over the fabric, this is because they do not produce any traffic and simply want to receive traffic, this makes it hard for device tracking and in turn fabric to not work for those devices
edges nodes have multiple probes going on to speak to those silent devices but there are some devices which are ultra silent and dont even respond to those probes
This command helps in troubleshooting those scenarios because if ARP is not working over fabric then communication will not work
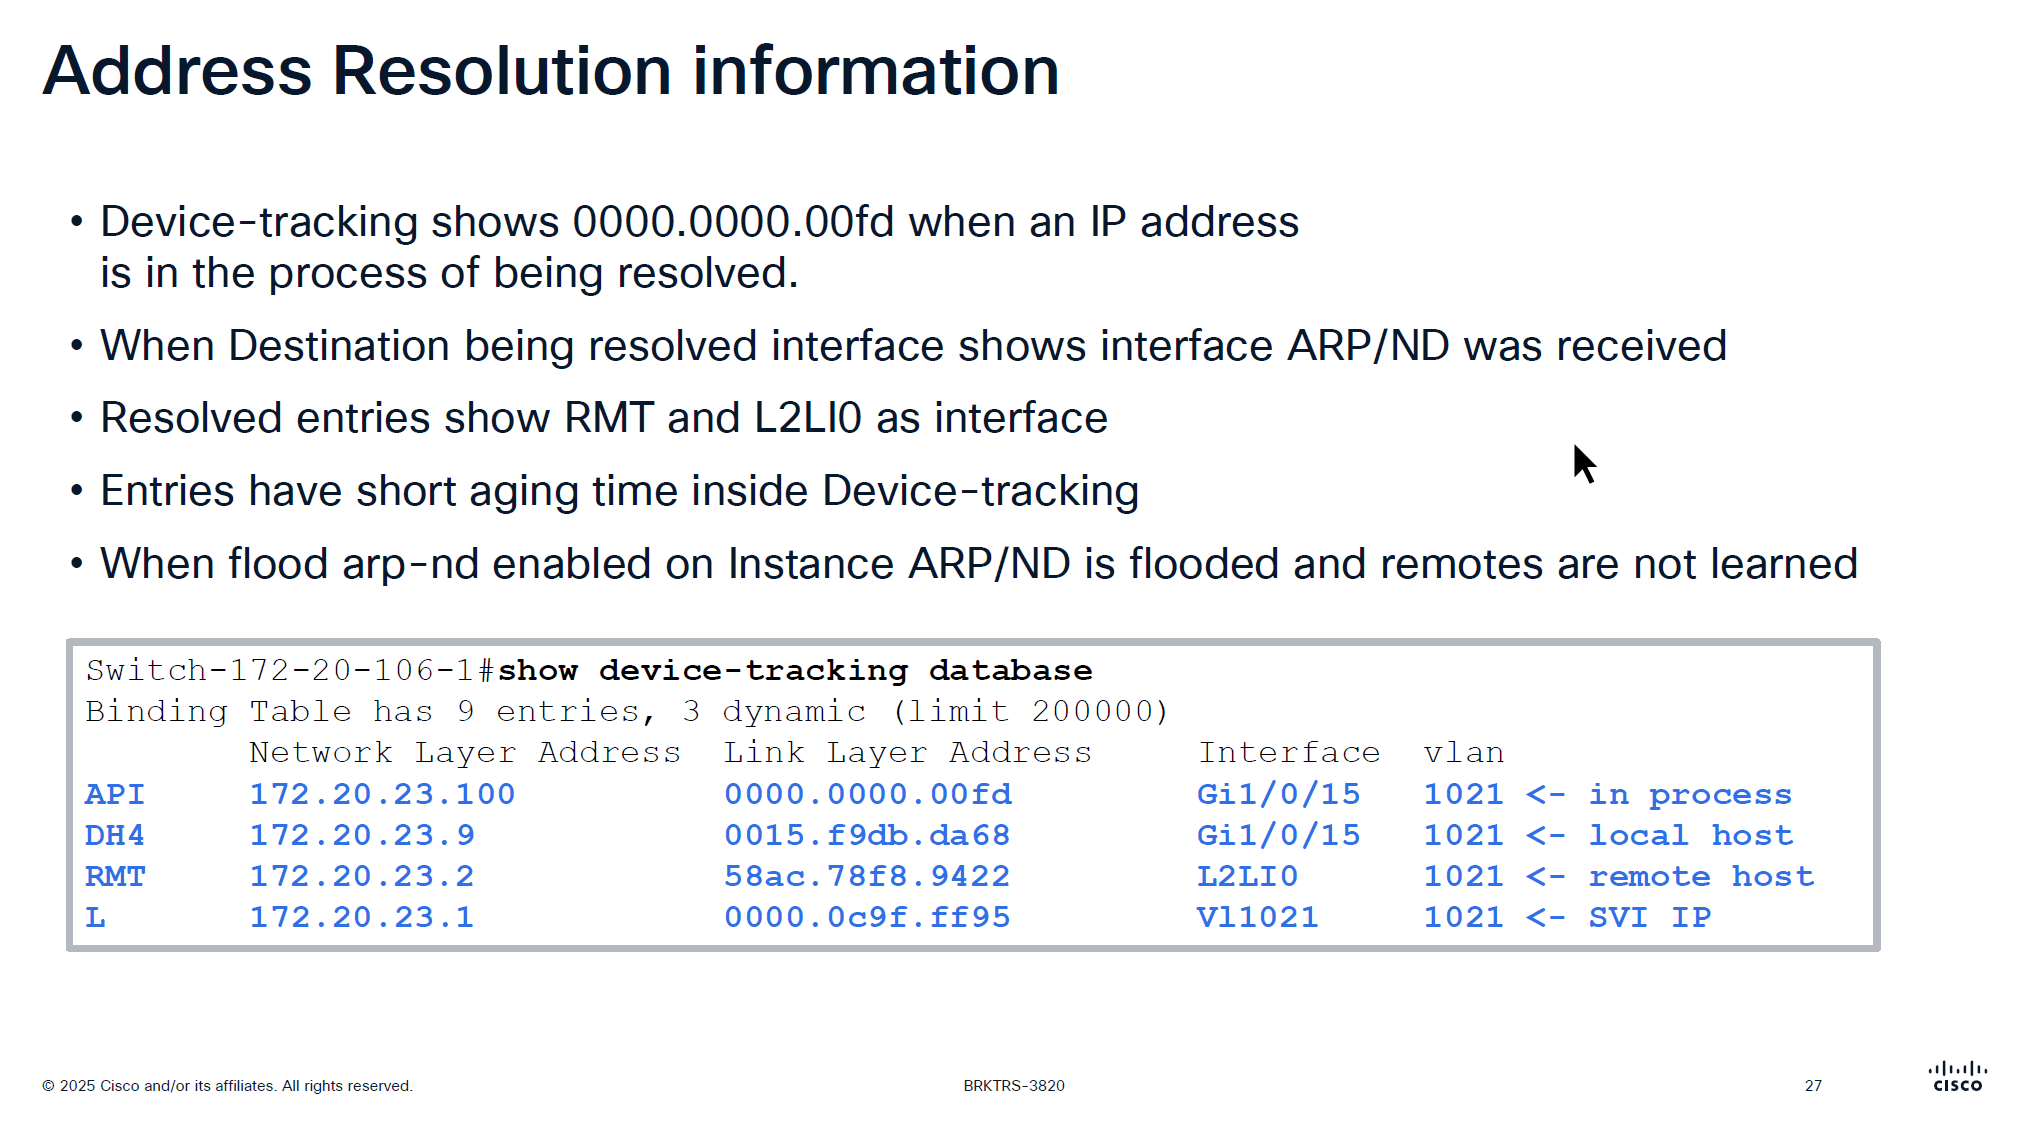
This someone pinging 172.20.23.100 and it arrived on Gi1/0/15
If you see entry for API with mac 0000.0000.00fd in command “show device-tracking database” then it means that ARP packet arrived on the edge node but did not have response from Control node over LISP yet and waiting to be resolved to convert ARP broadcast into unicast
After this resolution completes entry becomes “RMT” (which I guess means remote) with L2LI0 as interface
Because device tracking timers age quickly, this process of ARP resolution might be happening again
Important to note that unicast ARP is received on the remote device and sometimes some IoT devices in testing showed that does not like unicast ARP and only respond to broadcast ARP so in that case we will have to enable the Flooding over the VLAN
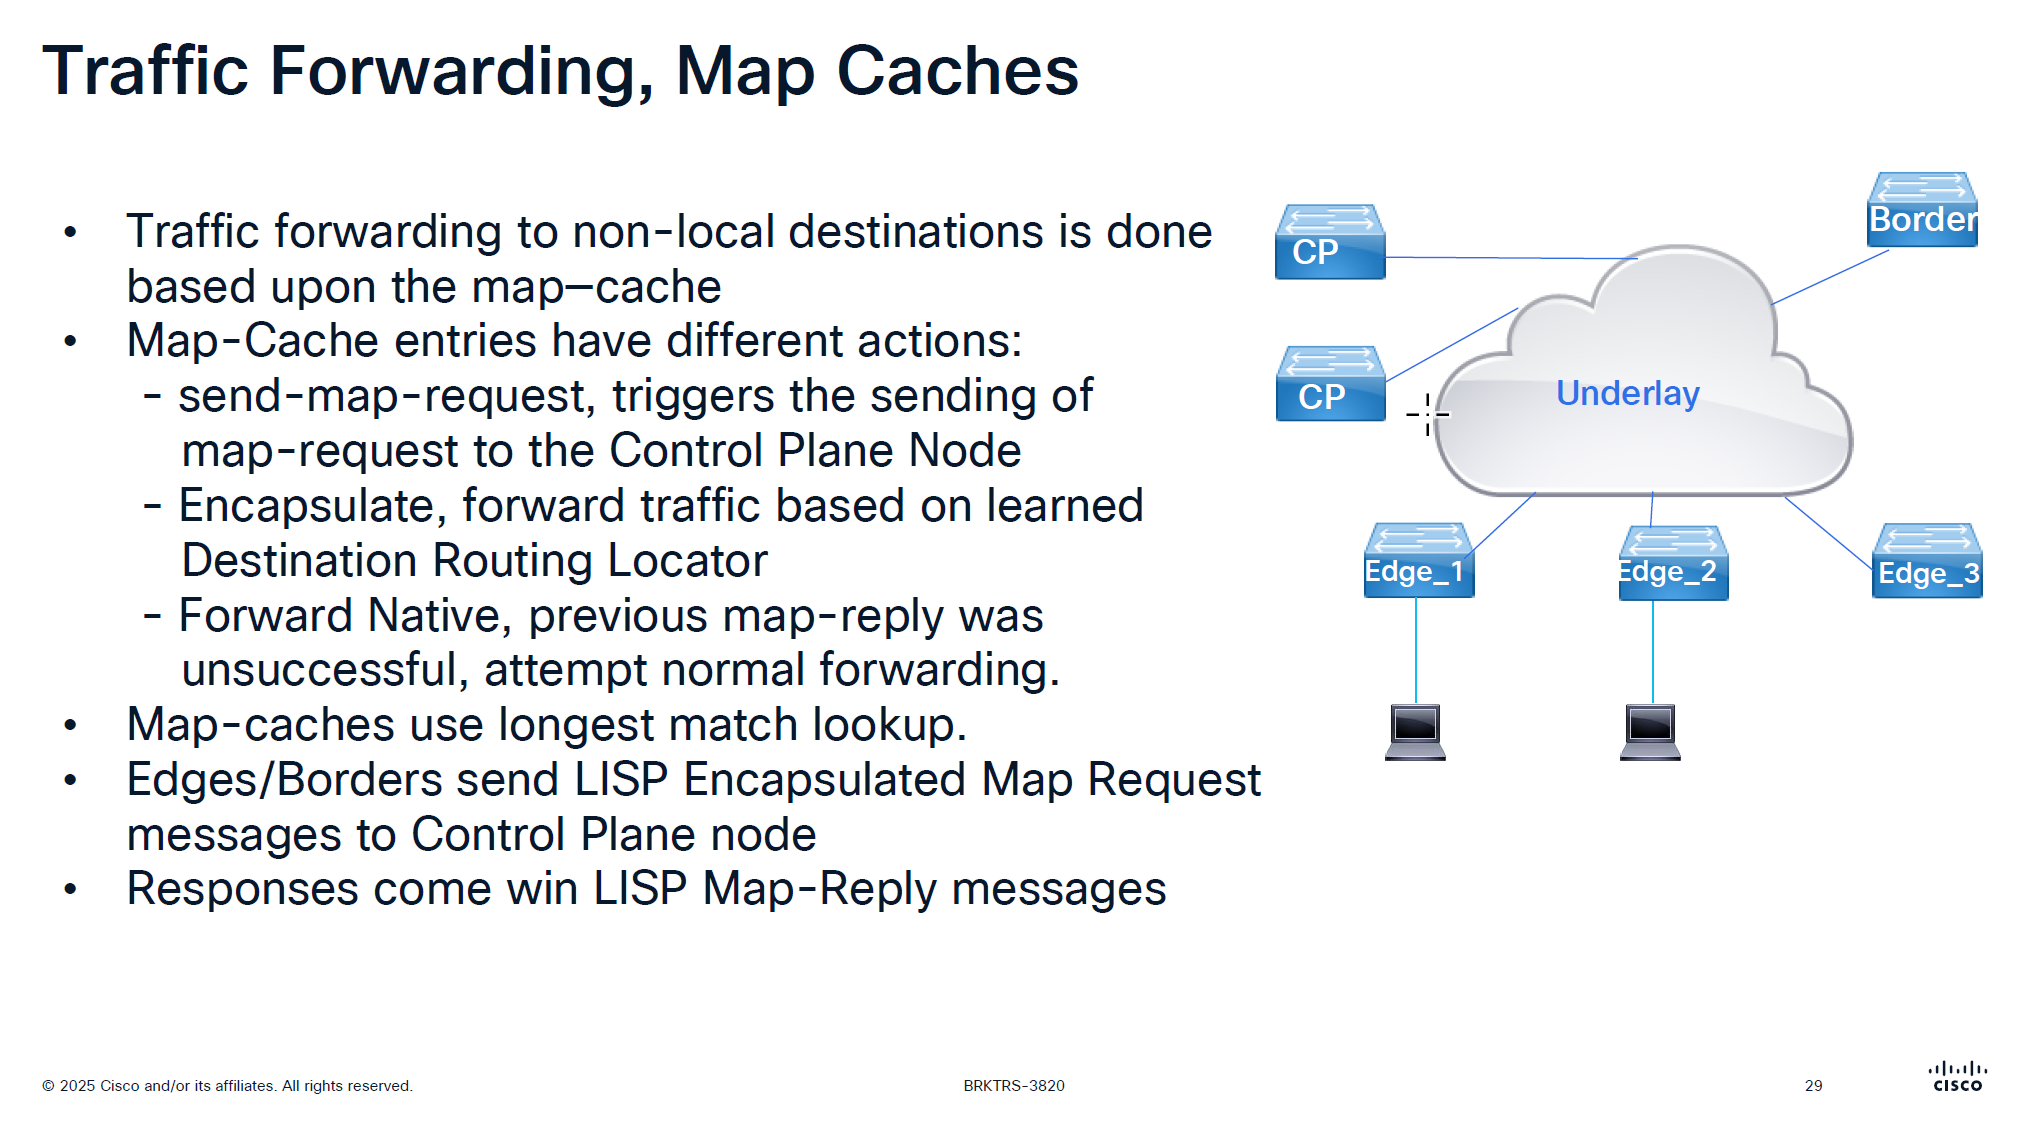
It is no good to speak to control plane about every packet we get
That is why edge node has map-cache to cache the RLOC received for an endpoint for 24 hours
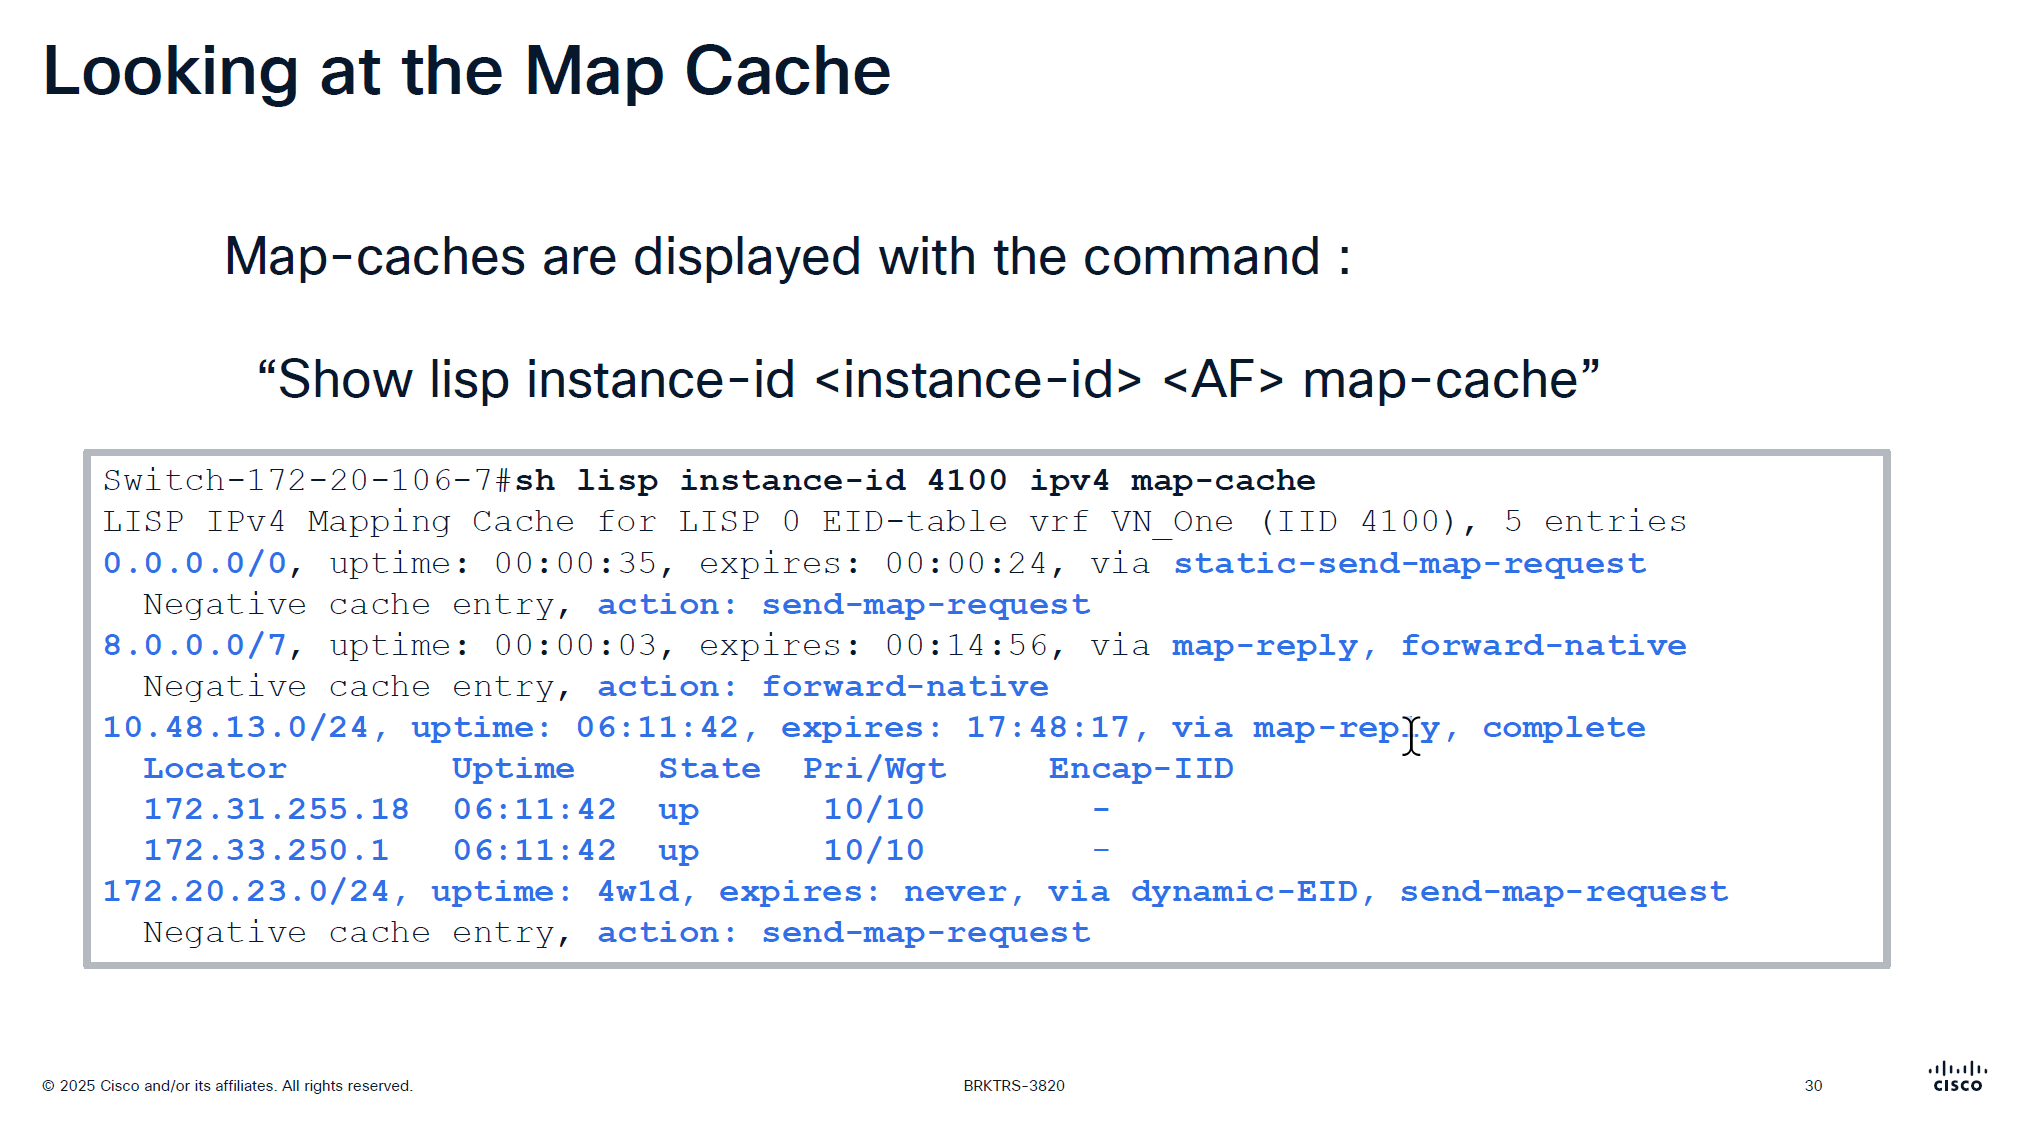
See action
The reason it is 0.0.0.0/0 has action send-map-request because even if we have default border or even dynamic default border we need to still ask control plane node as there might be a better path for destination
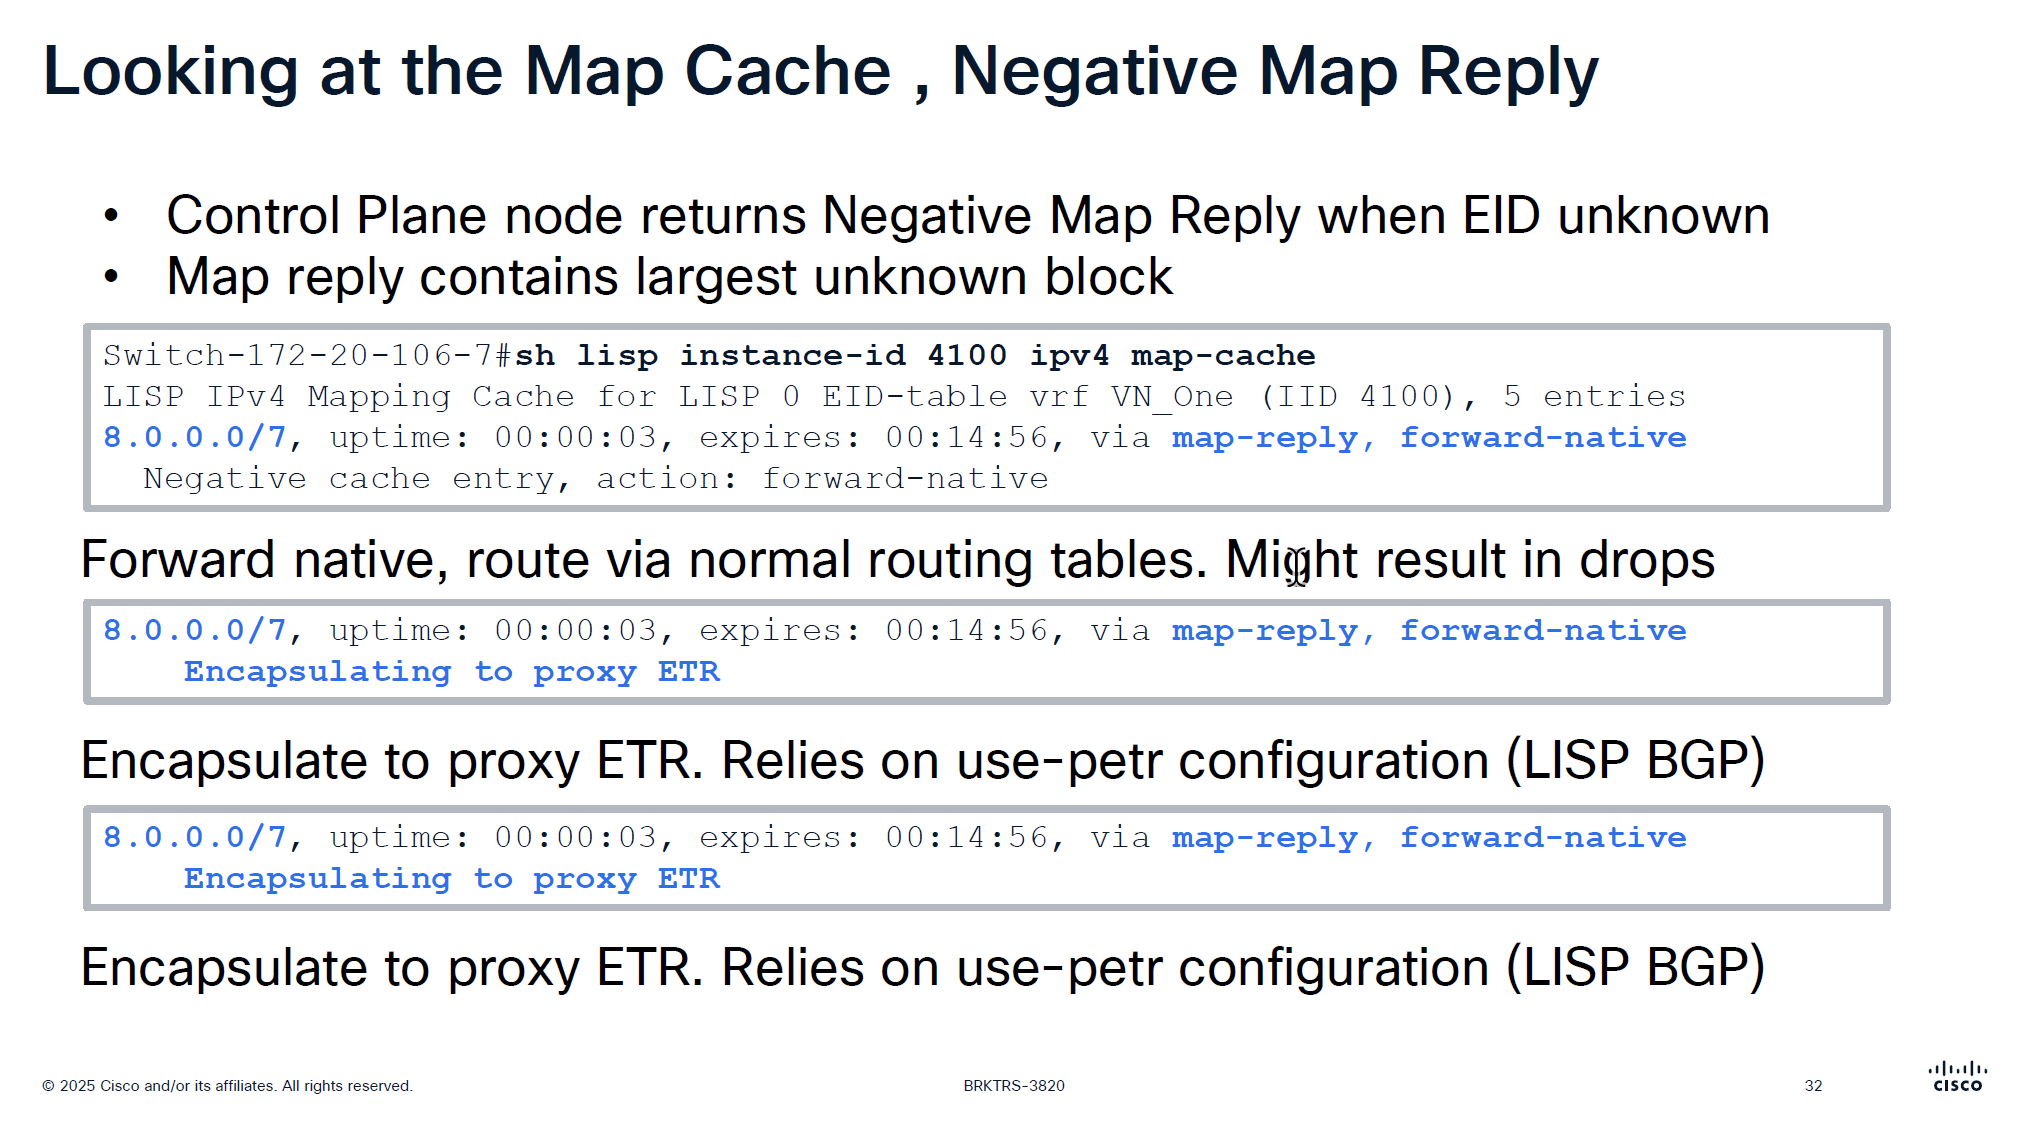
On each edge node in order to reduce queries to control plane node a few “negative” map-cache entries are added in advance with forward native action, forward native on border means to use routing table and not LISP which can have ISIS , OSPF , BGP or static entry for any routes falling under this range but for edge nodes forward-native means connection will be dropped as there is no other means other than LISP
This is done in weird blocks of 0.0.0.0/5 and 8.0.0.0/7 to tell that I dont have routes for those but I have default route 0.0.0.0 and other prefixes we learned from outside fusion world
This is only there for “expires” time which is 15 minutes, the whole function of map-cache is to not consult control node, so this entry means that for those unknonwn destinations do not ask or reach control plane but as this entry expires, edge can reach out to the control plane node instead try to use the routing table (action: forward-native)
0.0.0.0/0, uptime: 1y29w, expires: never, via static-send-map-request
  Encapsulating to proxy ETR
0.0.0.0/5, uptime: 00:00:34, expires: 00:14:25, via map-reply, forward-native
  Encapsulating to proxy ETR
! 0.0.0.1 - 7.255.255.255
8.0.0.0/7, uptime: 38w5d, expires: 00:04:38, via map-reply, forward-native
  Encapsulating to proxy ETR
! 8.0.0.1 - 9.255.255.254
10.16.101.0/24, uptime: 1y29w, expires: never, via dynamic-EID, send-map-request
  Encapsulating to proxy ETR
10.64.0.0/11, uptime: 38w5d, expires: 00:05:08, via map-reply, forward-native
  Encapsulating to proxy ETR
10.116.2.0/24, uptime: 1y29w, expires: never, via dynamic-EID, send-map-request
  Encapsulating to proxy ETR
10.116.3.0/24, uptime: 1y29w, expires: never, via dynamic-EID, send-map-request
  Encapsulating to proxy ETR
10.116.4.0/24, uptime: 1y29w, expires: never, via dynamic-EID, send-map-request
  Encapsulating to proxy ETR
Above slide is little bit wrong
For LISP Pub Sub deployment we see “Negative cache entry, action: forward-native” but for LISP BGP deloyment we see “Encapsulating to proxy ETR” but see below
8.0.0.0/7, uptime: 38w5d, expires: 00:13:47, via map-reply, forward-native
  Sources: map-reply
  State: forward-native, last modified: 38w5d, map-source: 172.20.239.124
  Active, Packets out: 1535384(884381184 bytes), counters are not accurate (~ 00:00:35 ago)
  Encapsulating to proxy ETR
it will use the normal routing table (no VXLAN/LISP encapsulation) because the entry is forward-native, even though a proxy ETR (172.20.239.124) is listed
This line can appear in map-cache entries when:
- the prefix is learned via map-reply
- a proxy ETR exists – A Proxy ETR (PETR) in Cisco LISP / SD-Access is typically the Default Border Node, not the Internal Border Node
A Proxy ETR is used when a fabric device needs to send traffic to destinations outside the LISP mapping system (for example: internet prefixes like 8.0.0.0/7).
Instead of dropping the packet (because no mapping exists), the fabric edge or border node:
➡ encapsulates the packet
➡ sends it to the PETR
➡ PETR forwards it toward external networks using normal routing
So PETR acts like an exit gateway for unknown/non-fabric destinations.
the state field of forward-native overrides it and tells to use RIB/FB
Cisco explains proxy-ETR usage like this:
When a destination EID is not reachable via the mapping system, a proxy ETR can be used for encapsulation, But only when the map-cache entry is in encapsulating state.
State Meaning forward-native use RIB/FIB encapsulating or complete send to ETR negative drop incomplete awaiting mapping
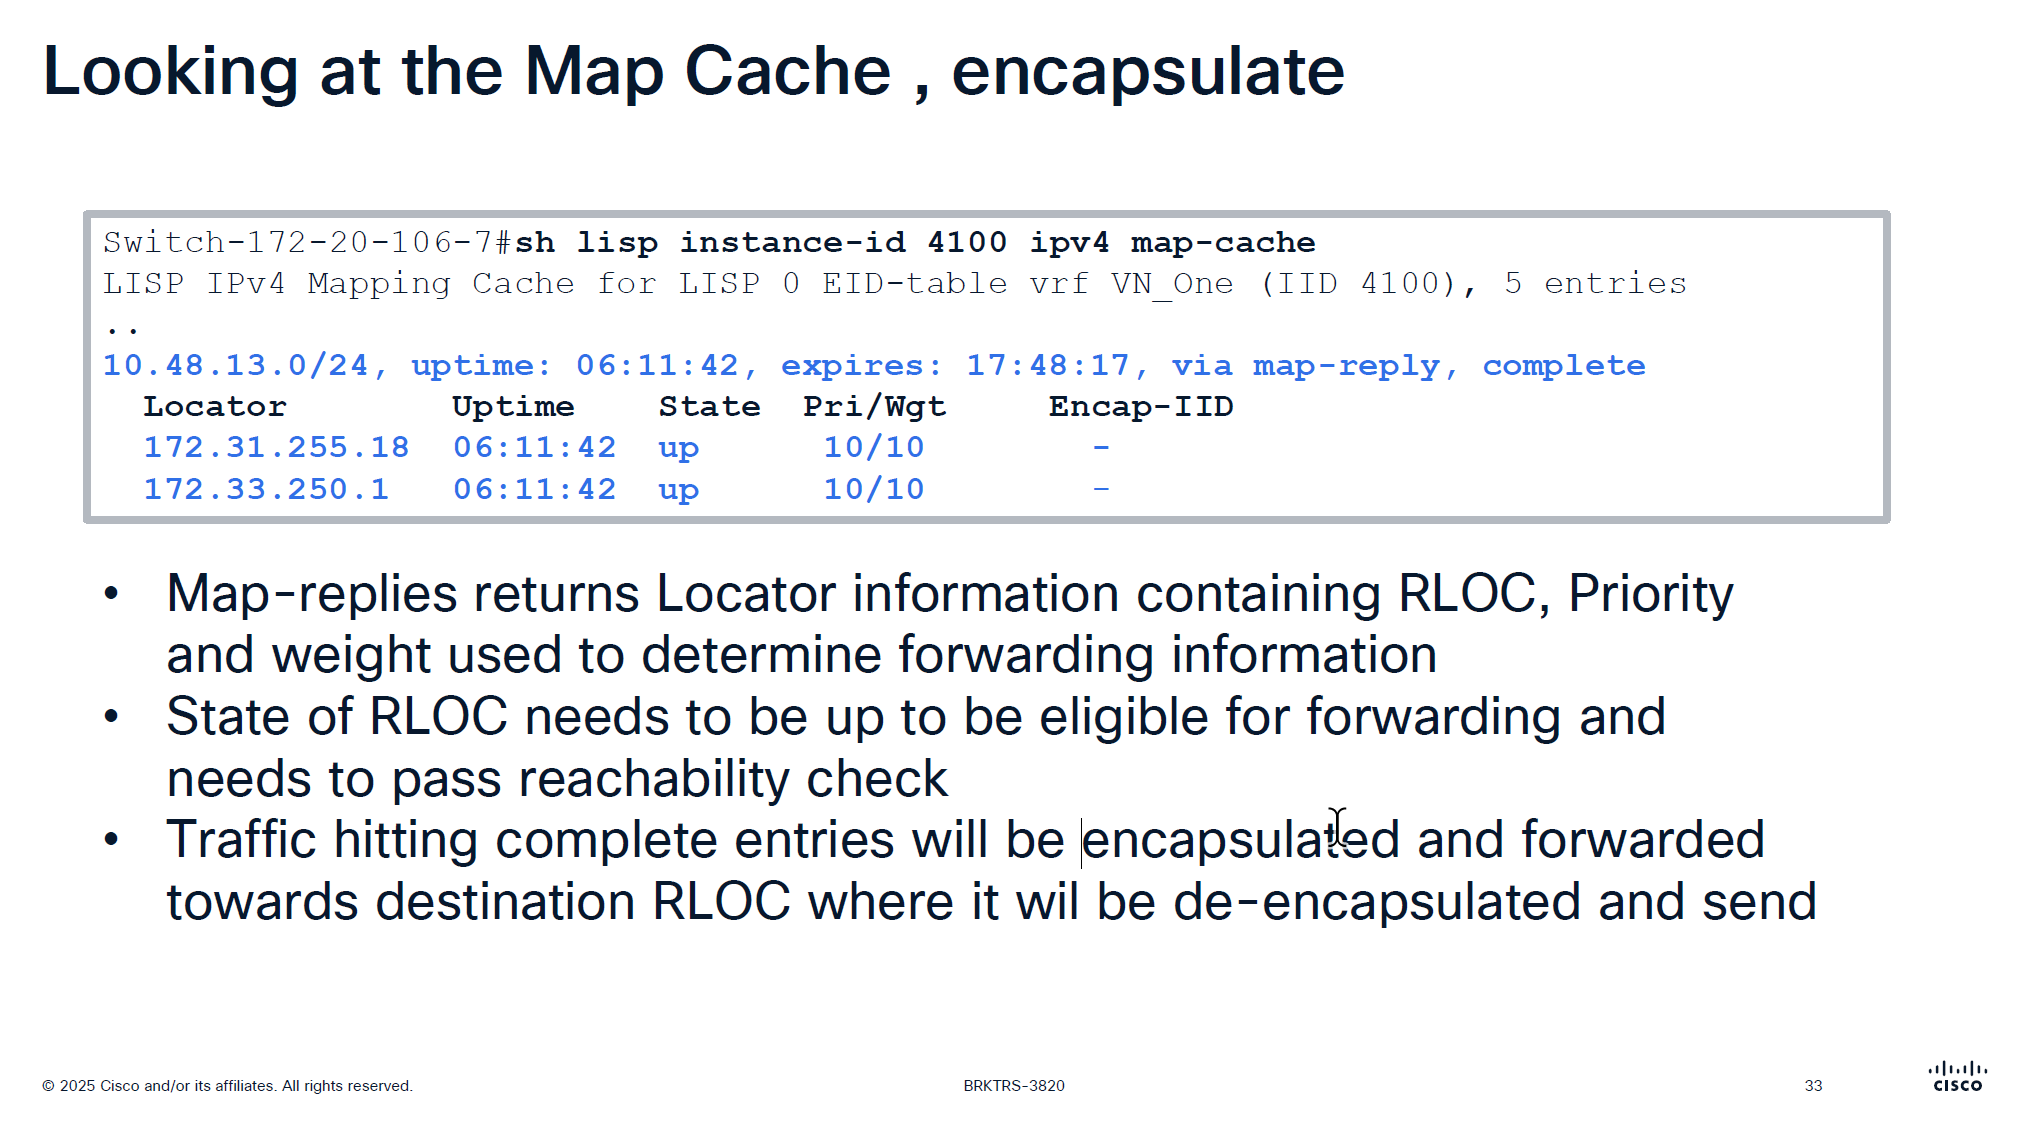
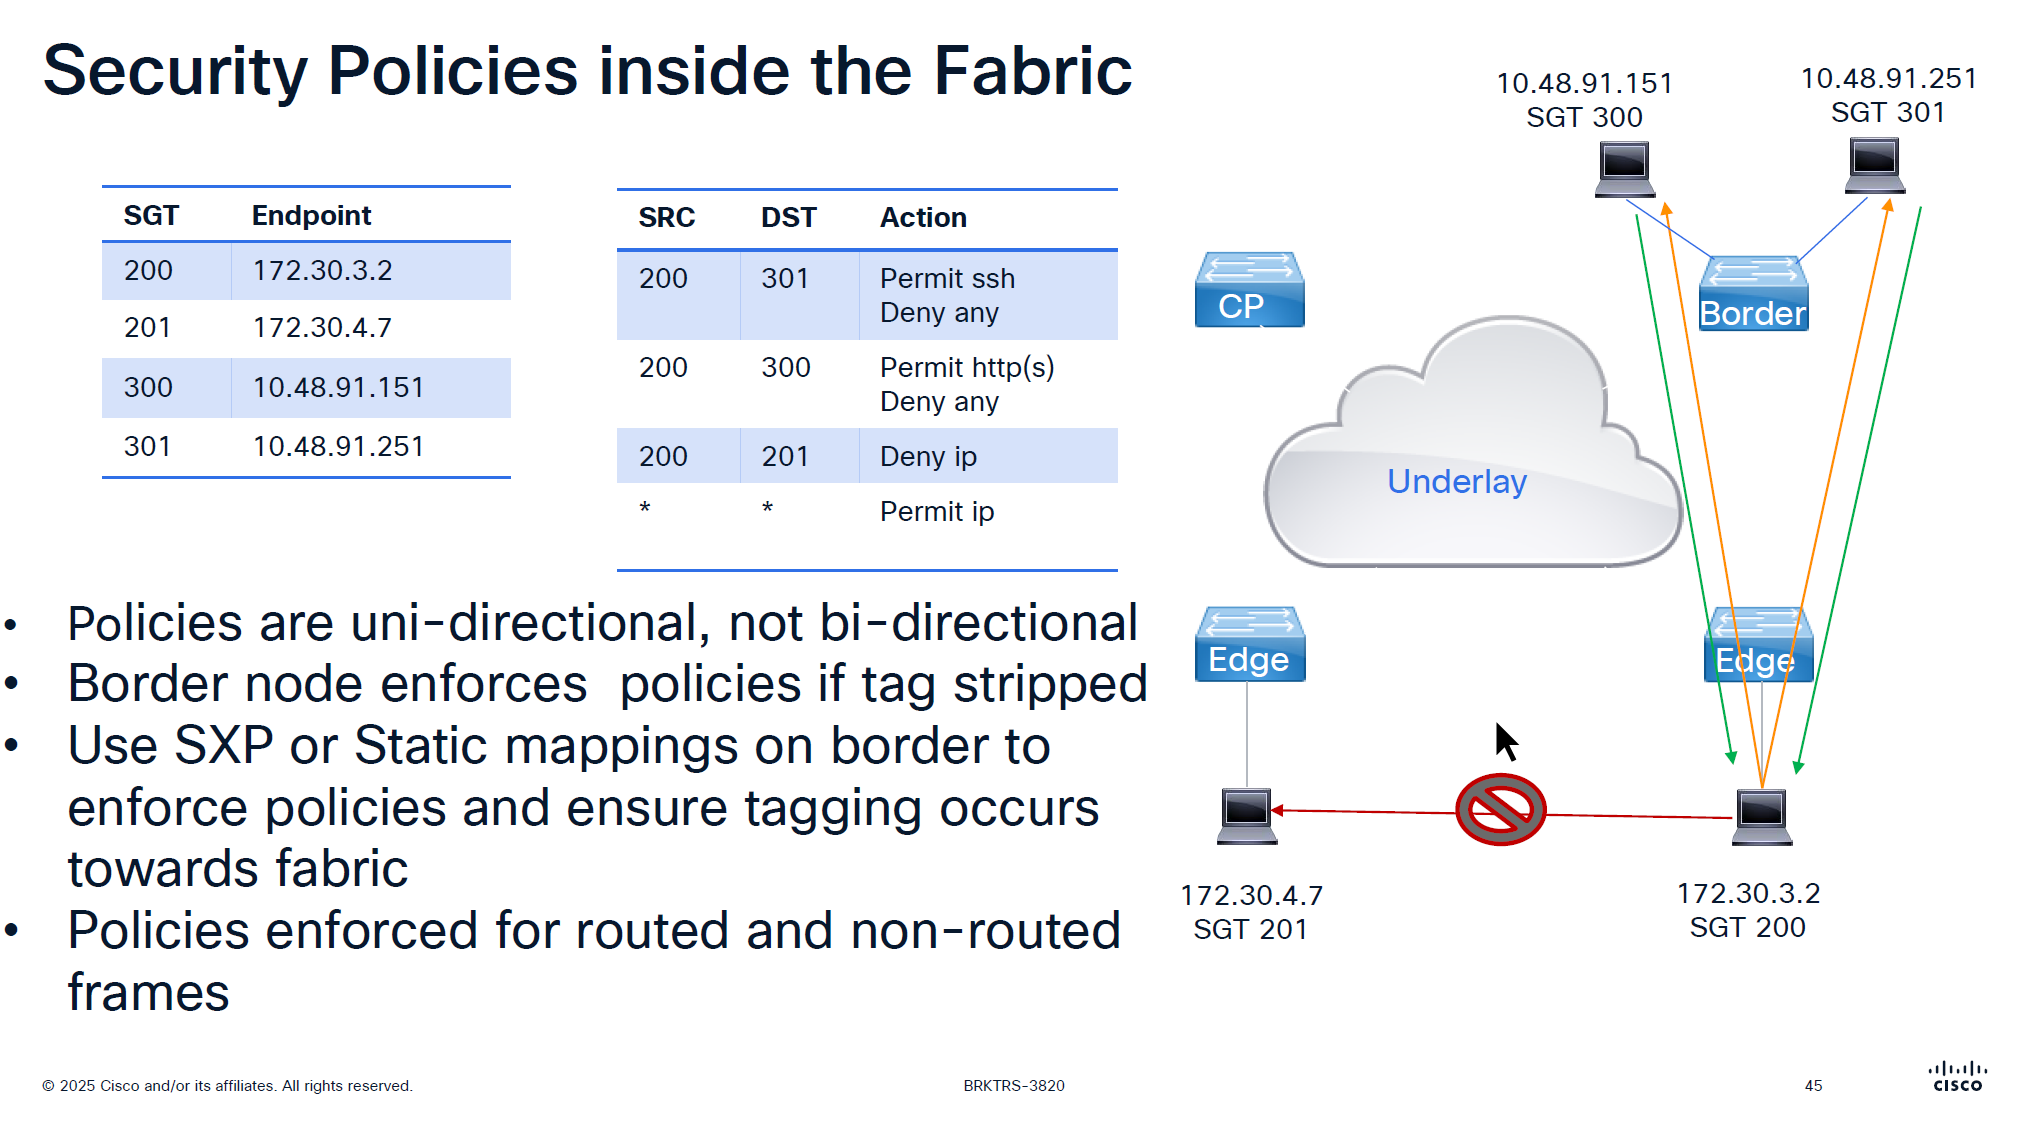
Because this is a subnet 10.48.13.0/24 behind a border, we see 2 borders
Whenever we see Pri/Wgt of 10 and 10 on both borders then it means we are load balancing at VXLAN level, like half flows are sent to one border and half flows are sent to another border and it is not gauranteed that VXLAN UDP packets to 172.31.255.18 are taking a single path through network always and not getting load balanced, even these VXLAN tunnel packets are also load balanced
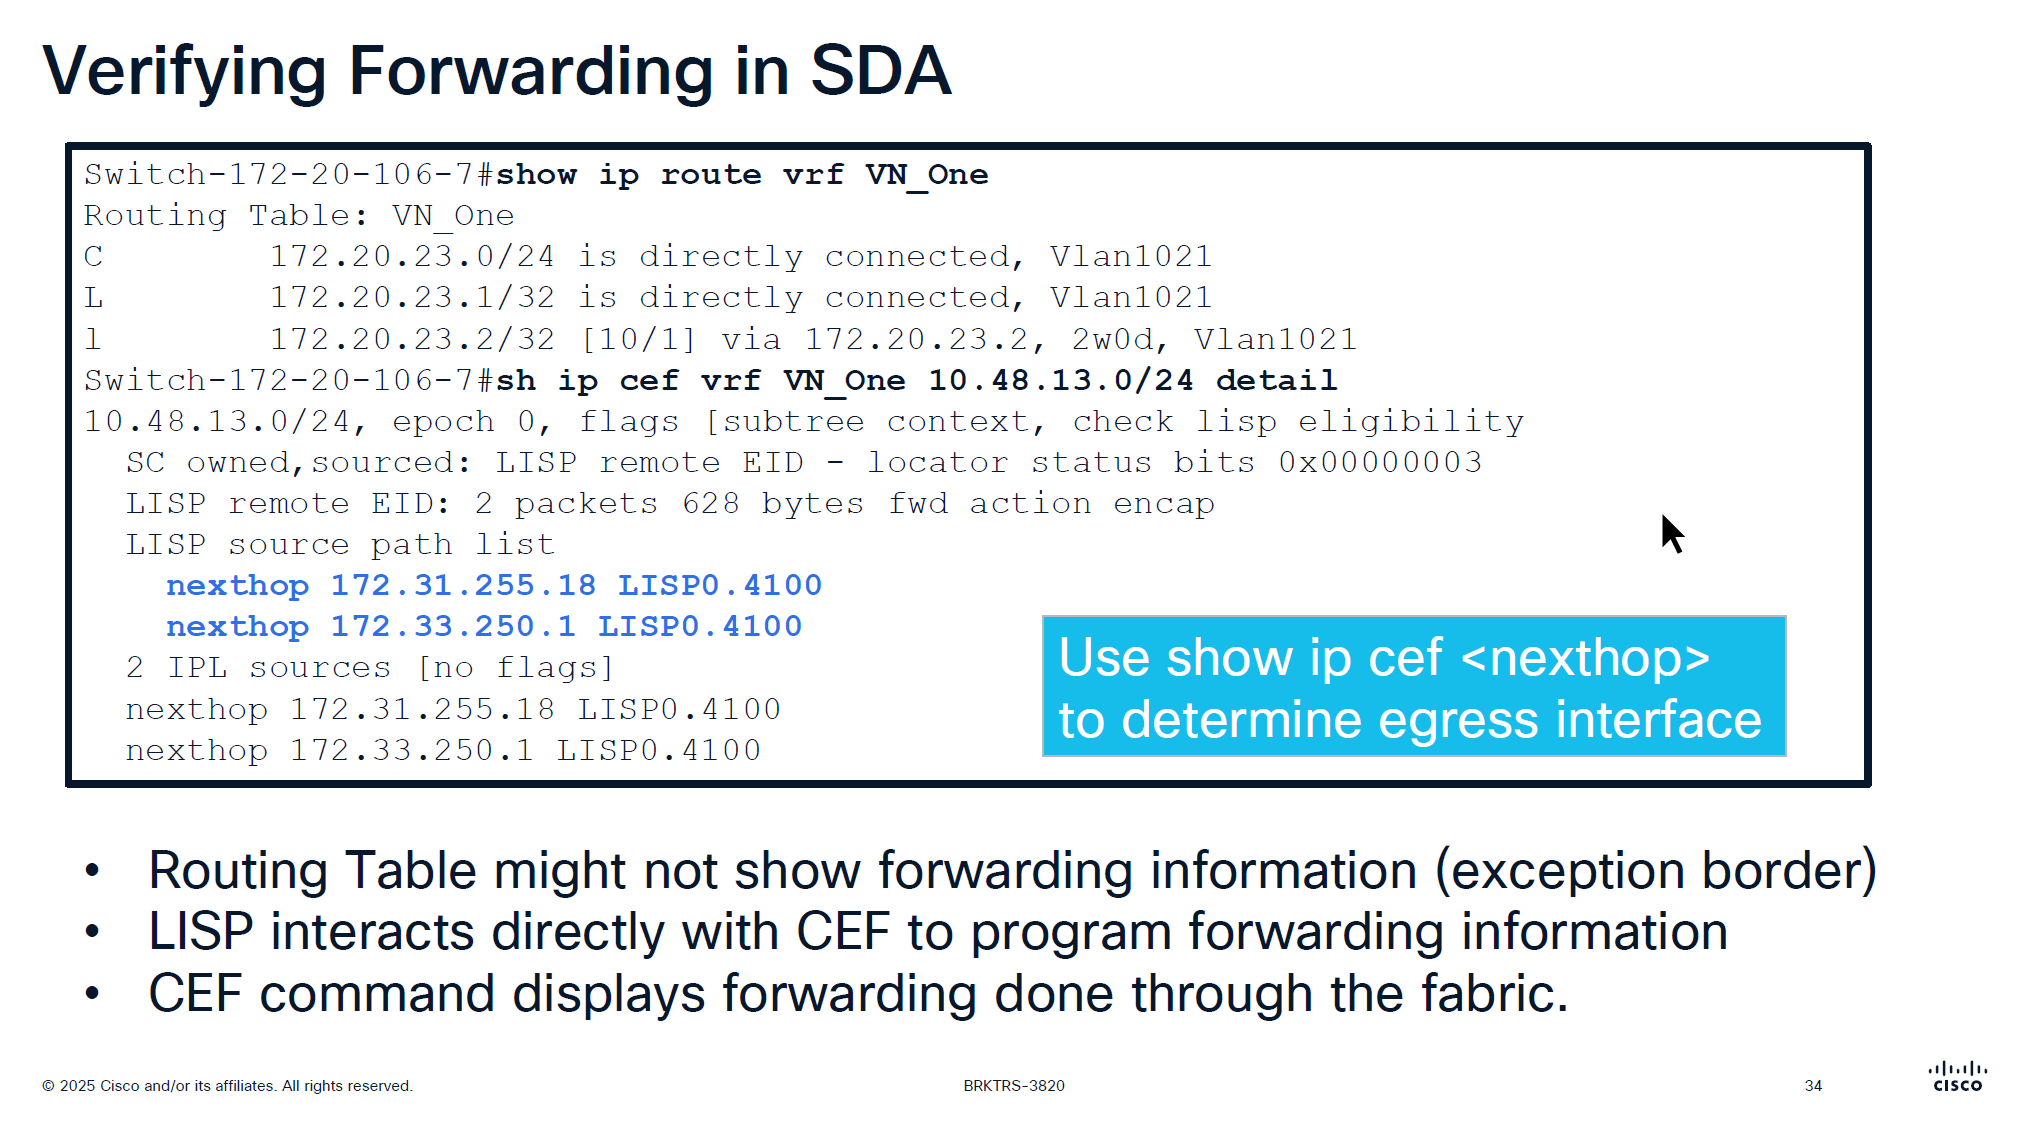
showing ip route in vrf will not show much except on border nodes but on the edge device there is no default route and no other routing present other than LISP VXLAN and fabric stuff
But if we check CEF there is more info because LISP -> CEF directly talks to CEF
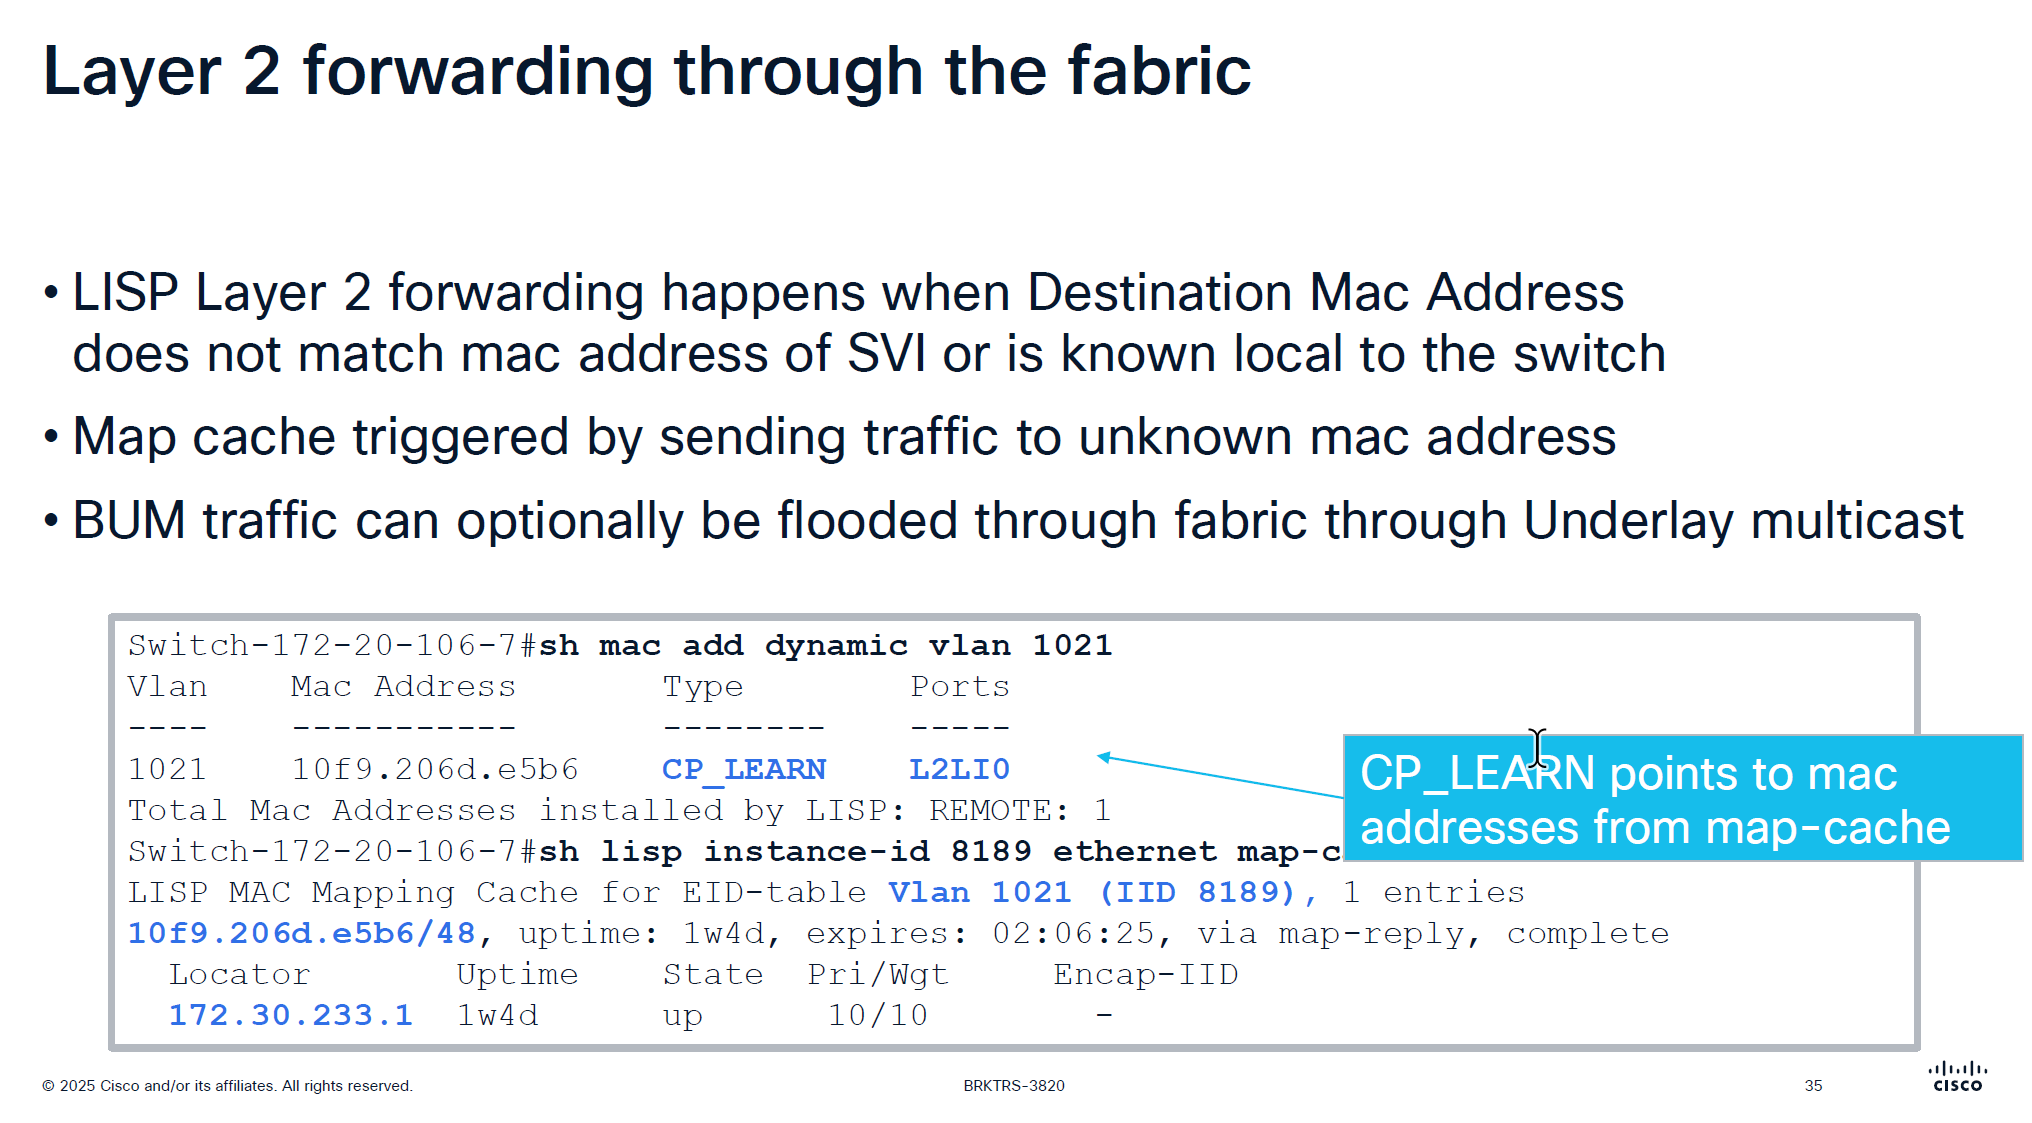
Layer 2 forwarding ia s bit different in fabric
Entry for dynamic MAC learning on edge shows CP_LEARN via L2LI0 tells that this MAC belongs to this vlan on a different edge node
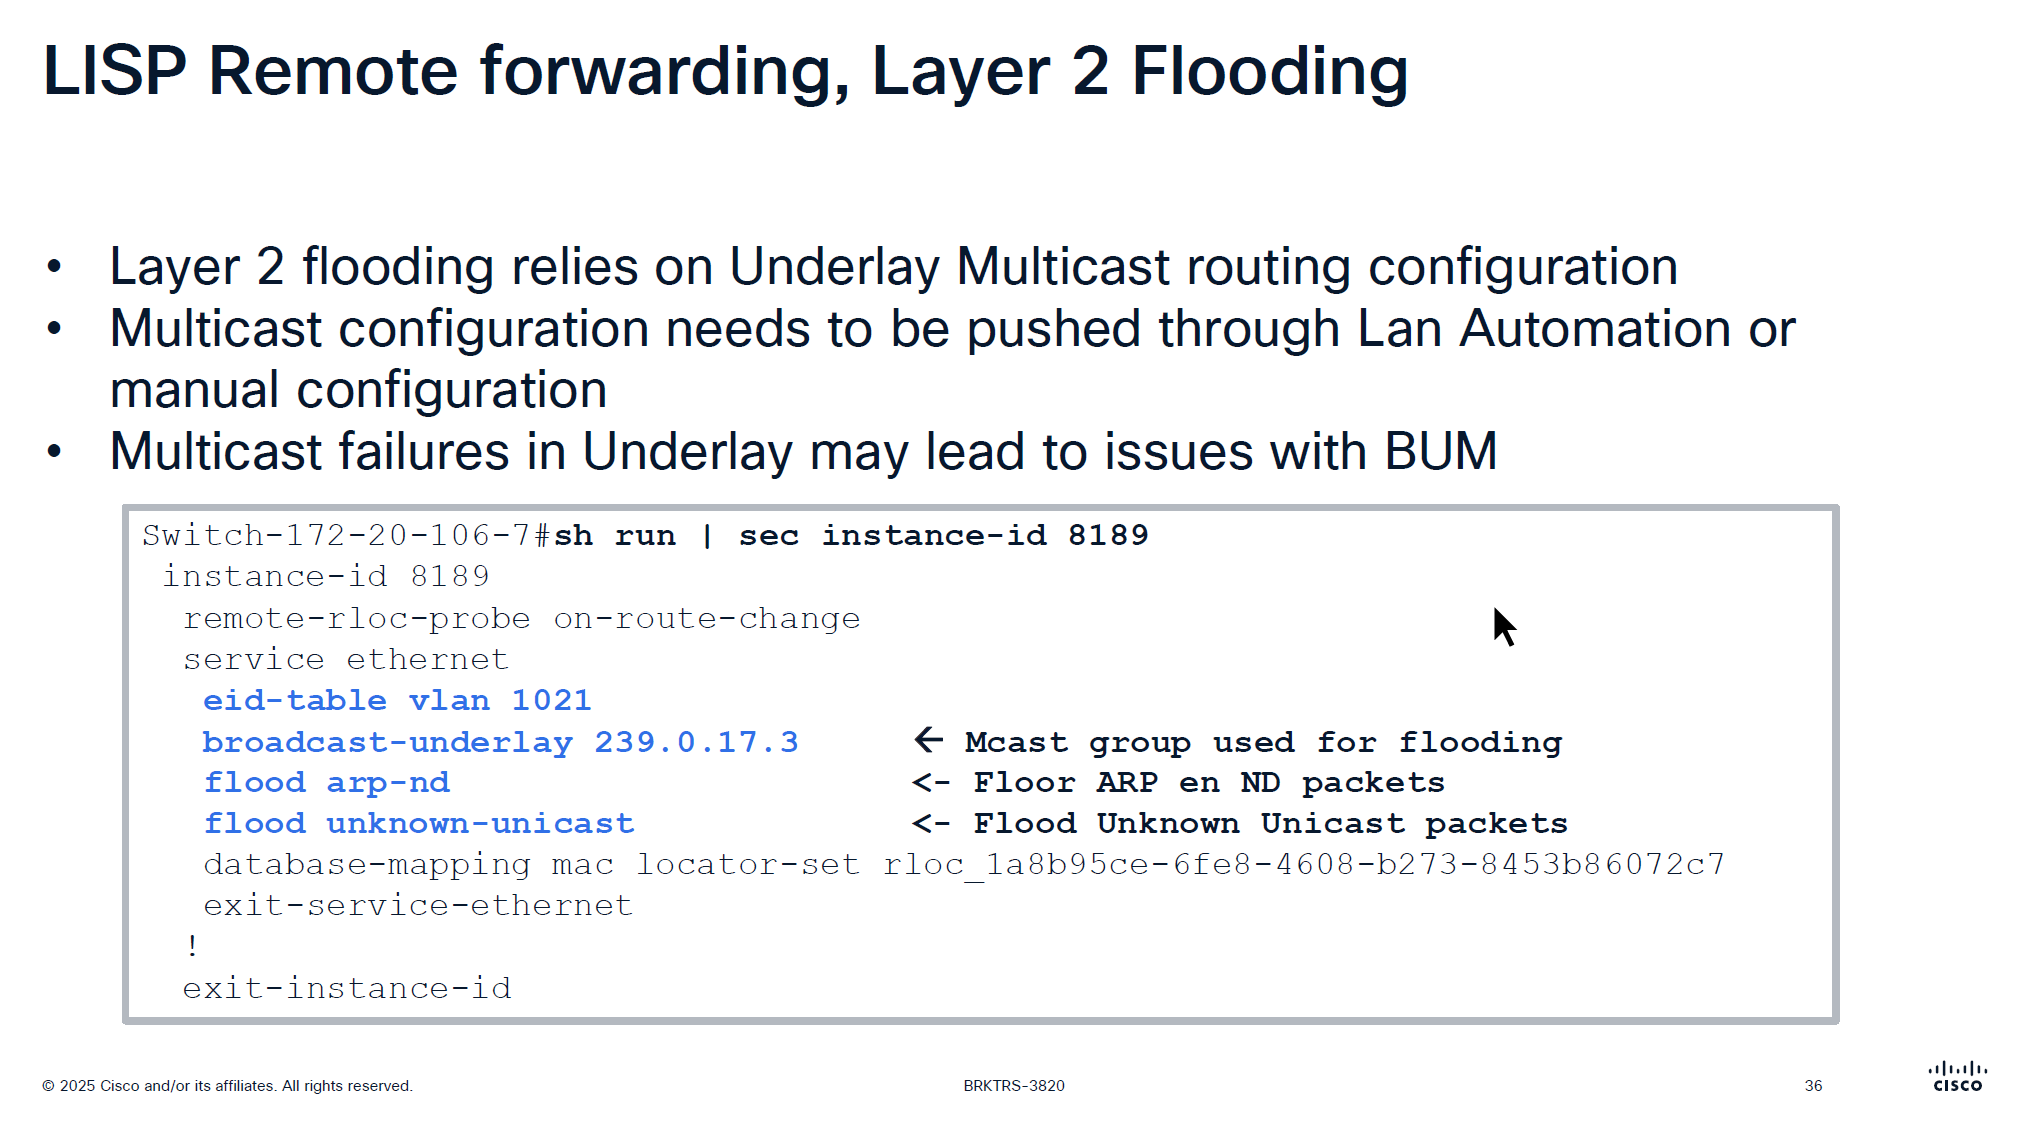
For layer 2 flooding to work on a vlan, the underlay multcasting needs to work
If LAN automation is used, it sets up the underlay multicast
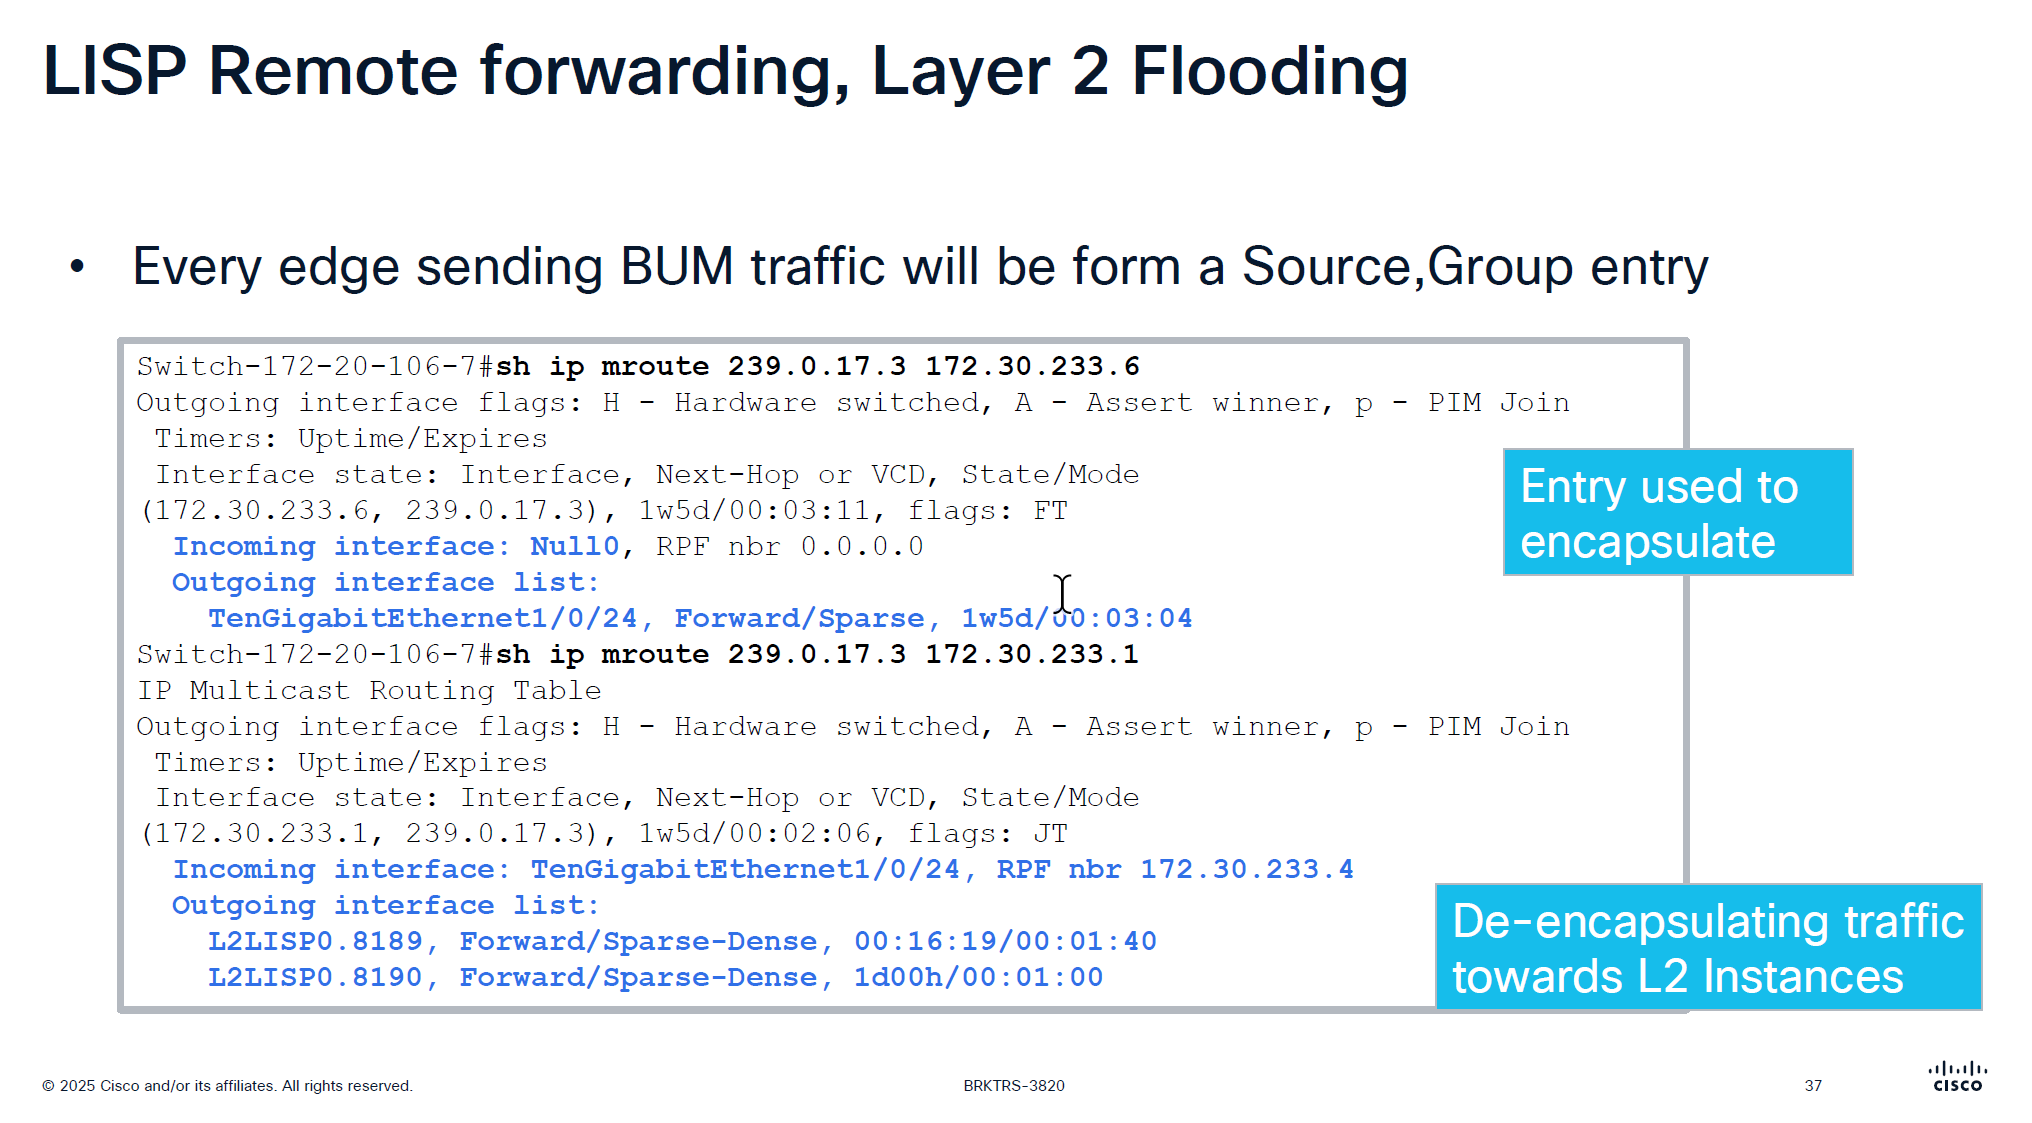
Every edge device shows up as source for a multicast group
We can see the 2 instances that are receiving the multicast traffic (flooded traffic)
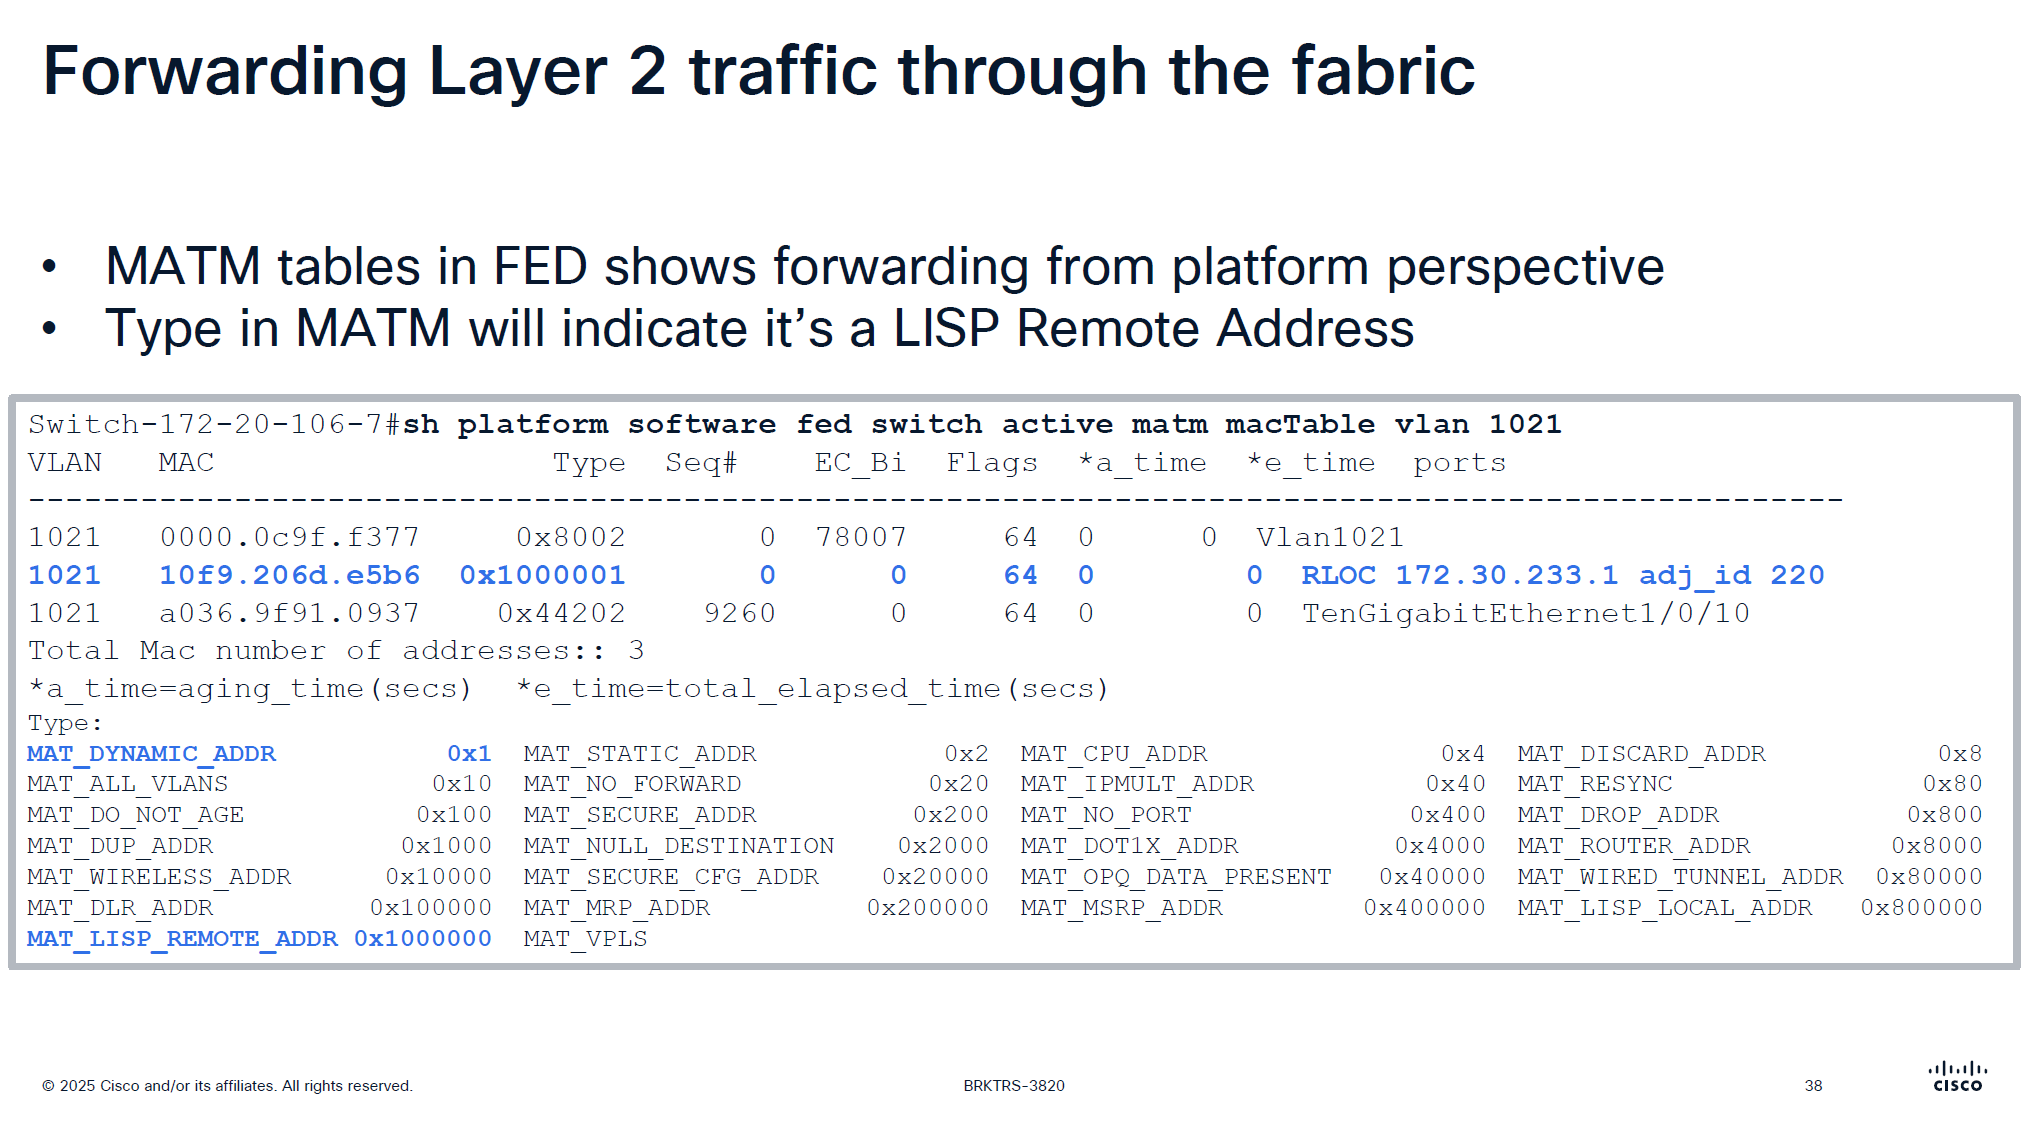
This is to verify if LISP is programming stuff correctly in hardware and this is where MATM comes in
MATM is CEF equivalent in layer 2

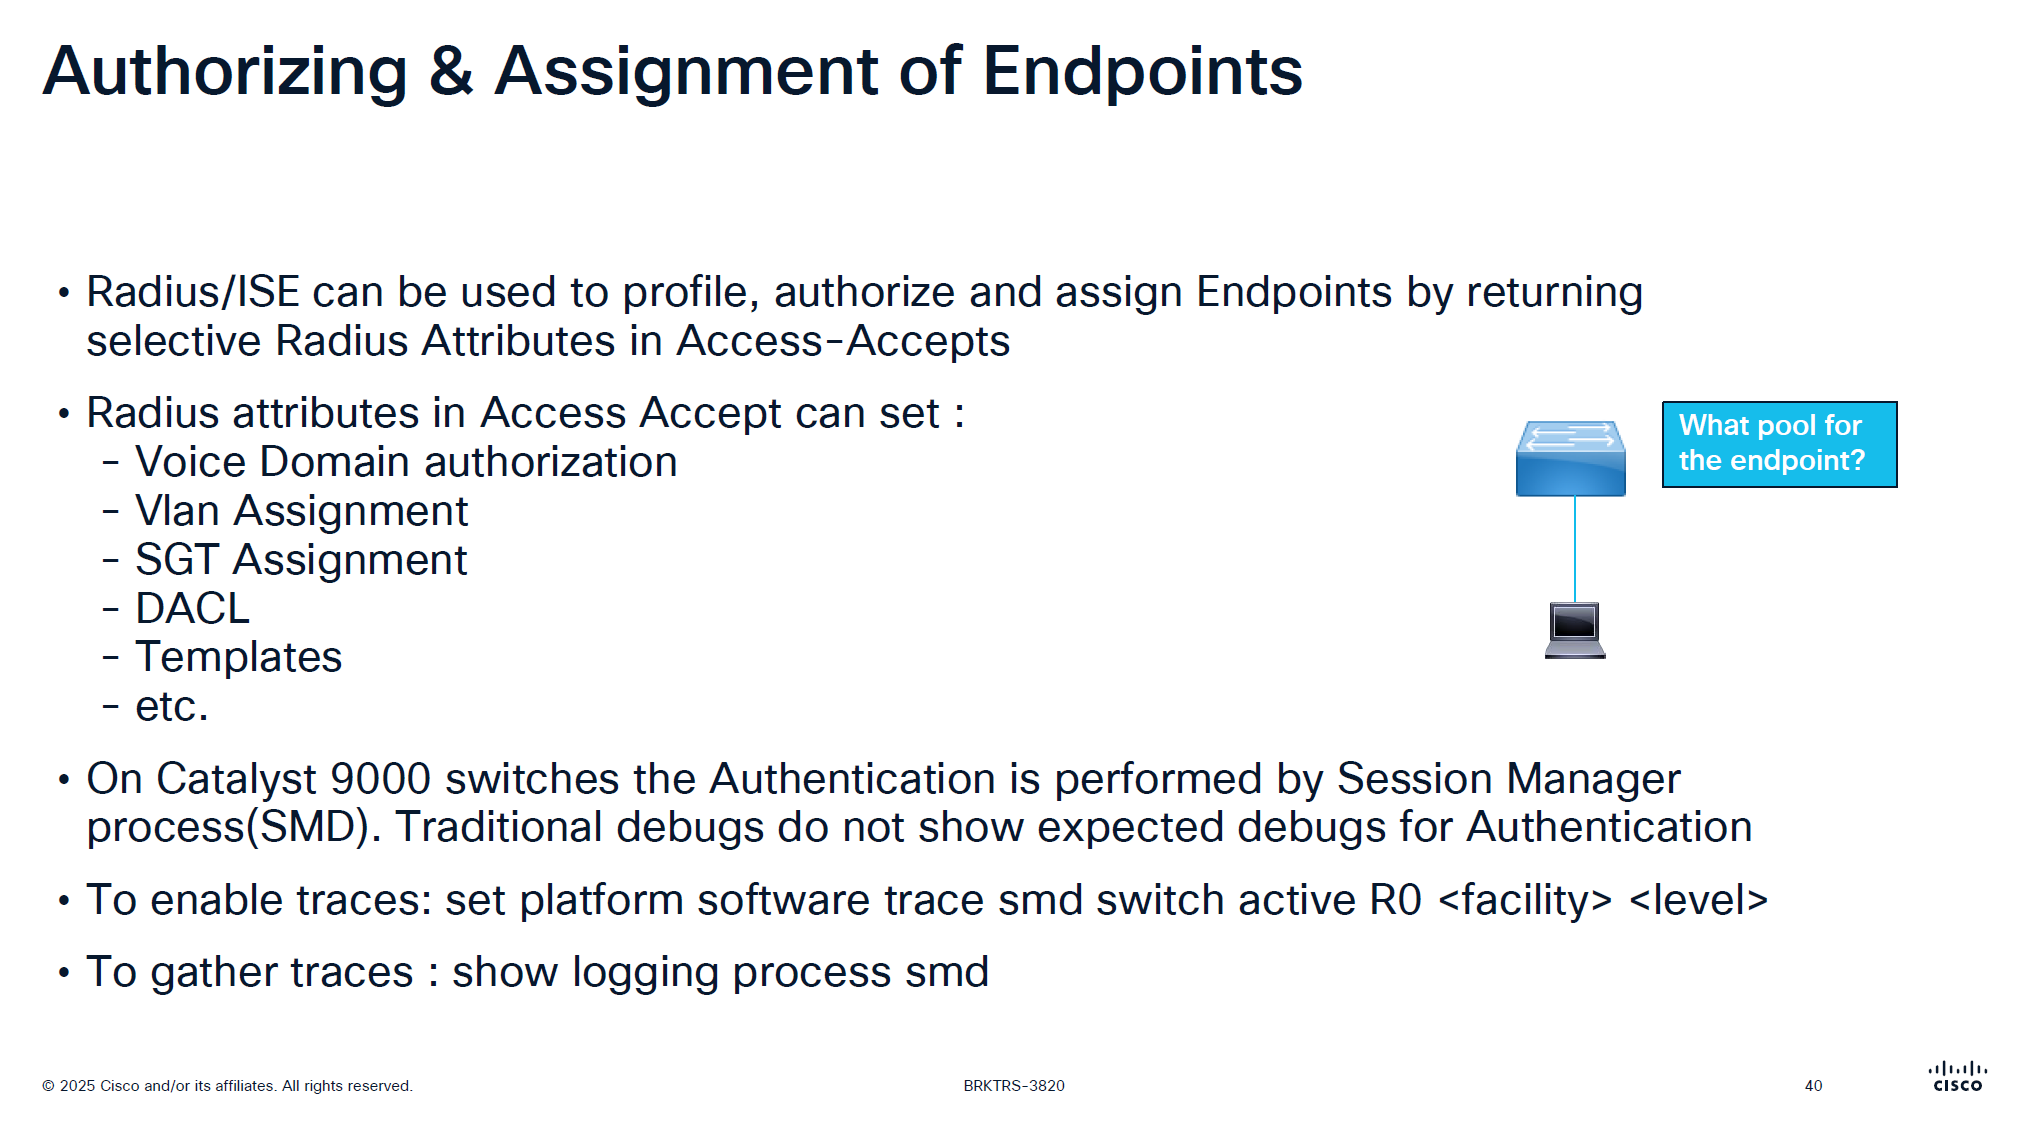
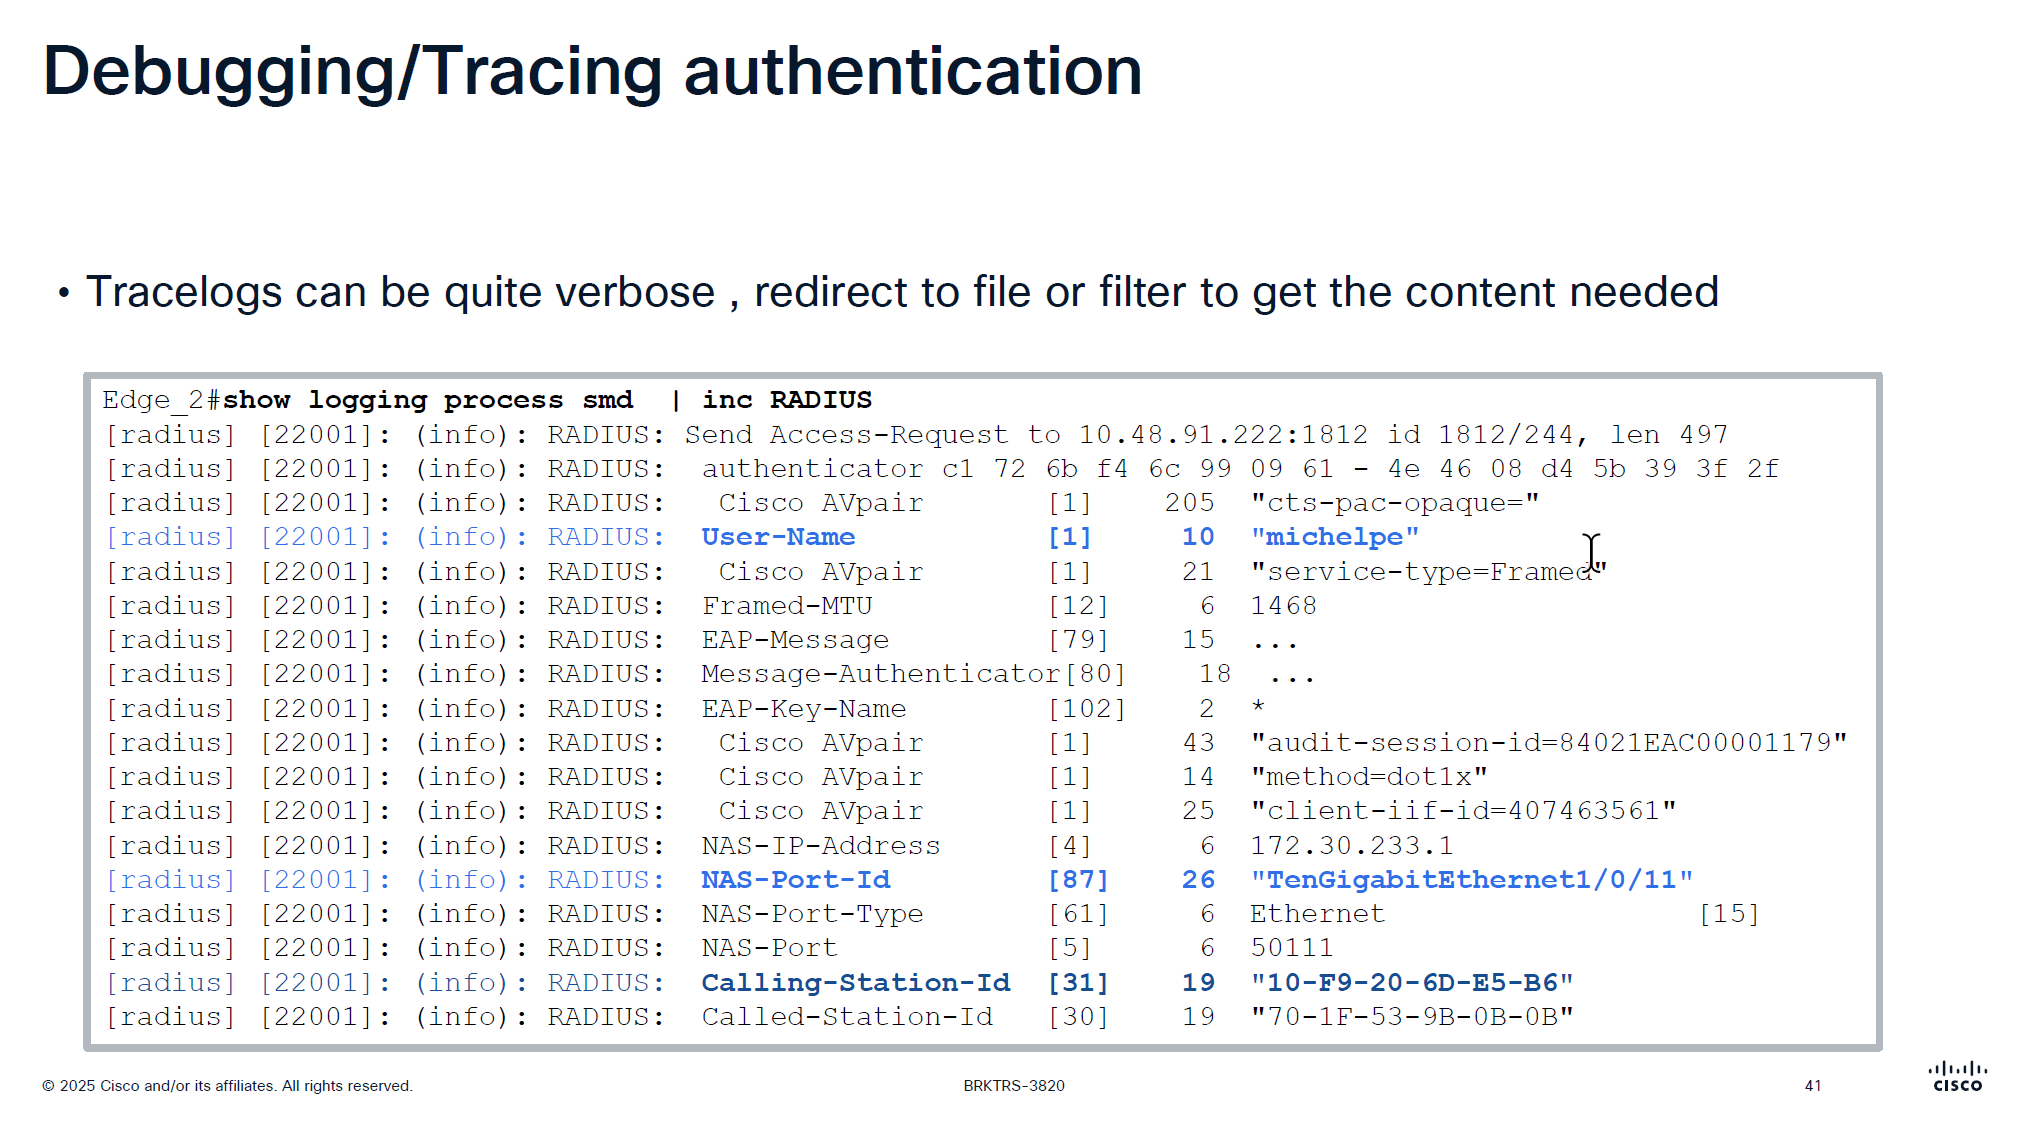
traditionally we could debug dot1x, debug authentication and debug radius etc but now we cannot do that, SMD sits as a seperate process outside of the iosd so we need to follow show logging <process> <name> format
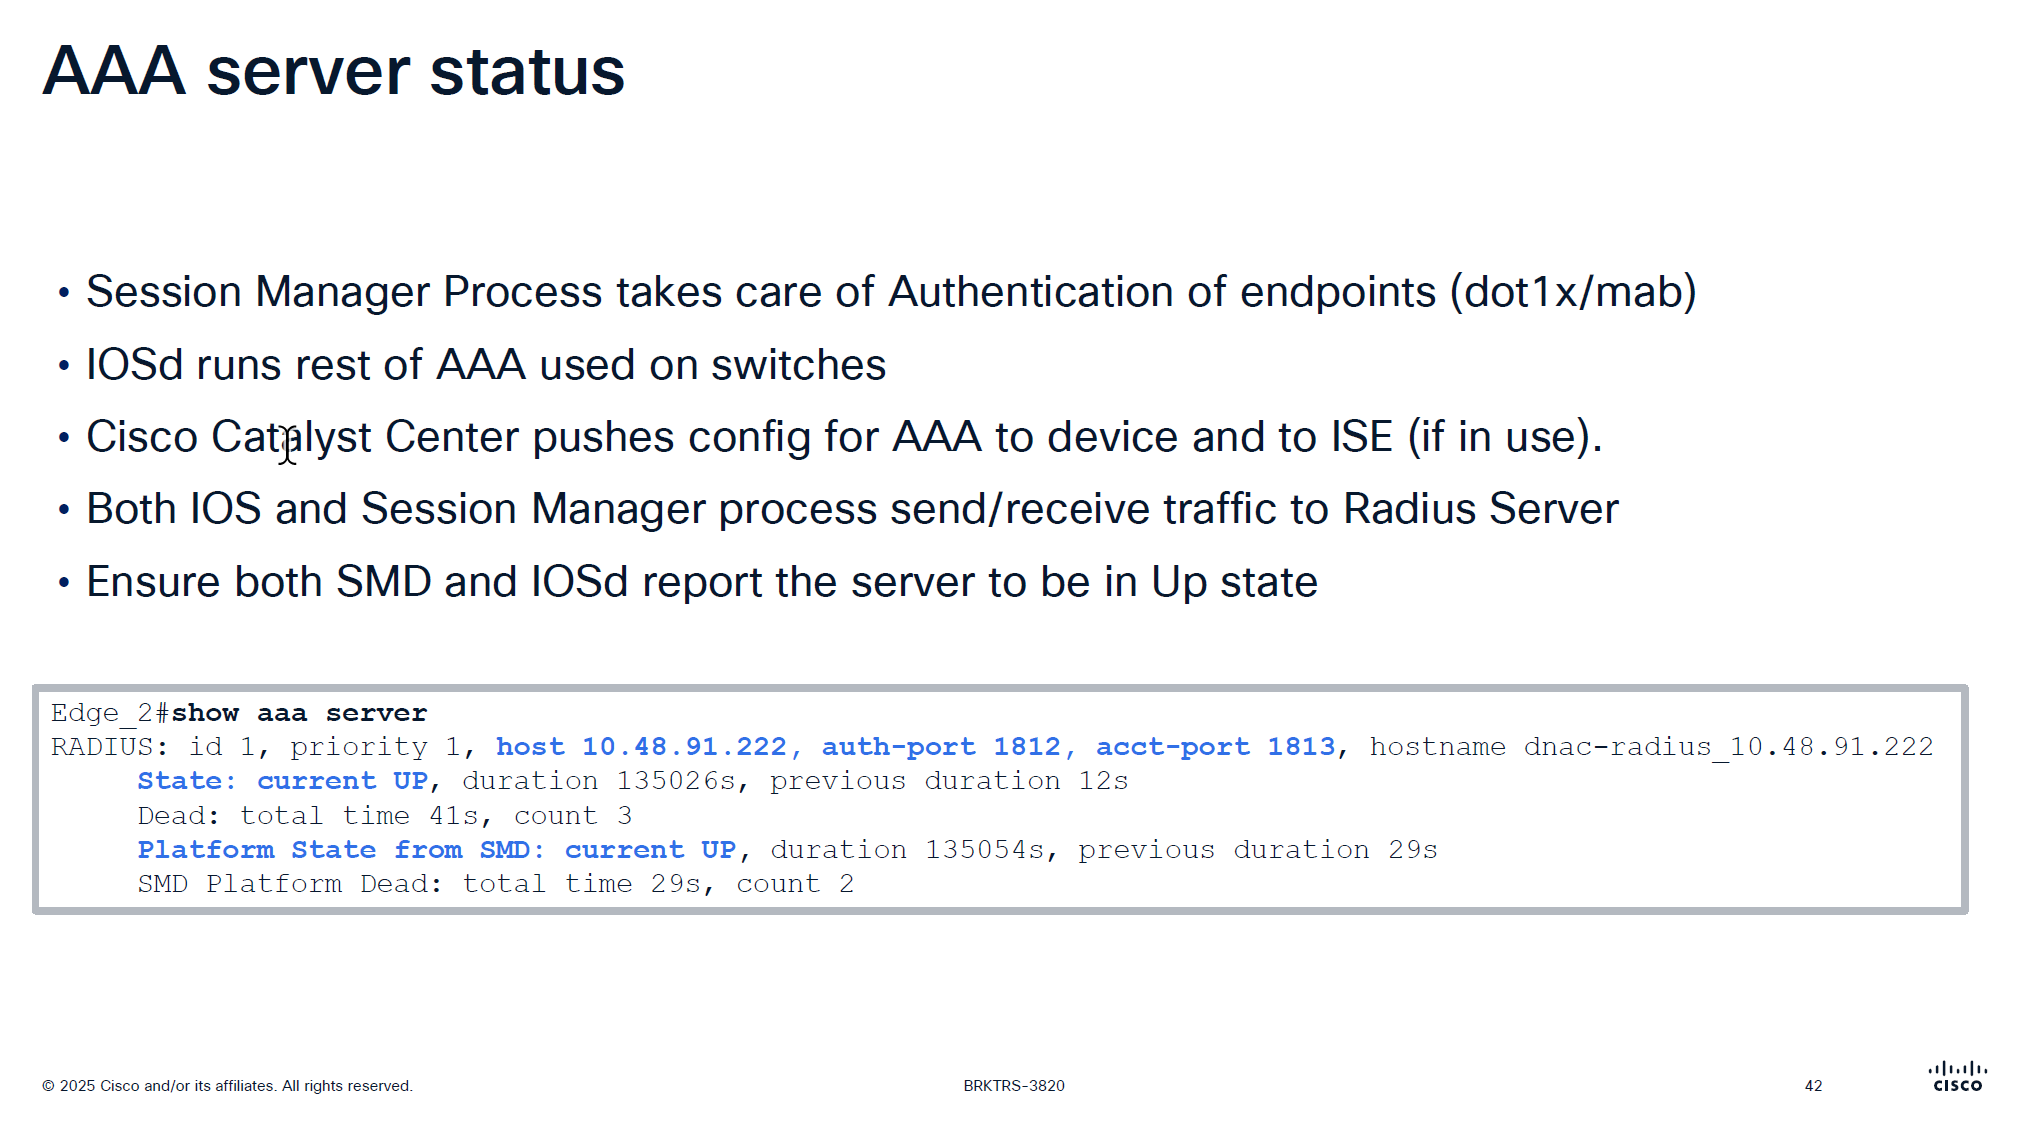
It is very important that RADIUS is up from SMD state as well
in some cases IOS thinks RADIUS server is up, but if it is down for SMD then it will not communicate with RADIUS server and it is waiting on keepalive timer to try again
more…
coming soon