CCNP Wireless
Chapter 1. Wireless Design Requirements
Imagine how critical it is for medical device that controlled a life support or patient safety function, you would probably want the wireless network to be fast, reliable, and available
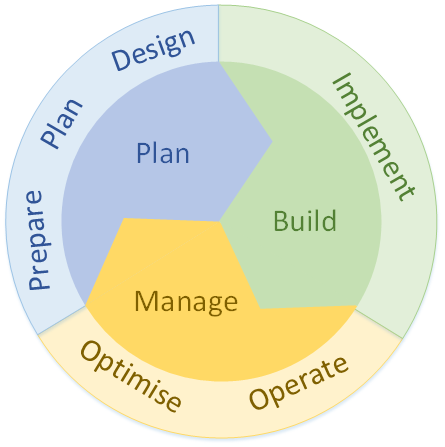
Cisco also uses the Plan-Build-Manage (PBM) process
Meet with a customer to gather requirements as part of the Prepare phase.
You perform site surveys as part of the Plan and Design phases
Verifying, monitoring, optimizing, troubleshooting, and hardening—tasks that usually take place in the Operate and Optimize phases.
Coverage vs Density
You might notice that one building has several large classrooms and a large lobby area. If you toured the building at a time when those areas were empty, you might not realize that the customer expects every classroom to support streaming video over the wireless network and that the lobby must support large numbers of people as they move between classes.
A healthcare customer might show you a large emergency department and an outdoor area where ambulances arrive. Unless you ask, you might not realize that the customer expects the outdoor area to have full wireless coverage for emergency staff, each carrying a wireless phone, as they move in and around a large number of ambulance vehicles. Ask about the need to cover stairwells, elevators, outside entrances, and other gathering places.
Some areas might need basic wireless coverage for users who are located throughout, and other areas have densely packed users and expect a high level of network performance, when more people are under one AP, air time is reduced for that AP and also load increases on that AP also
Always evaluate each area according to RF coverage versus capacity.
These topics are covered in greater detail in Chapter 5, “Applying Wireless Design Requirements.”
It might seem obvious that the focus of a wireless design is to provide wireless coverage in all desired areas. We should also take the client or user population into account so that network performance is acceptable to all users
With thorough site survey work, you should be able to choose the number and location of APs that are necessary because you have to buy APs based on site surveys, considering coverage and client density into the account
Types of endpoints
It is also important to find out the “type of devices” that will be using this wireless network for example in hosiptal environment we might have RFID tags , wireless body cameras, wireless phones and so on so it is important to ask in advance
When you have mix of devices, then compare all 802.11 standards supported for example some devices support a/b/g/n, while others support ac and one for ax. This information becomes important if you decide to disable specific data rates to improve performance and adjust the cell size of the APs. Fortunately, none of the devices requires “only” 802.11b, so you might think about disabling the slowest corresponding data rates.
Locked to specific channels
Sometimes devices are hard locked to use certain channels, each device type supports a specific list of channels on each band. On 2.4GHz, some voice communicator can work with channels 1 through 11, which may mean the device can be used only in the United States. The 5GHz channel specifications listed are not very consistent across the devices. This becomes important if a device supports channels that your design might have disabled. The device will still find APs operating on valid channels, but it may spend valuable time scanning the disabled channels to look for APs there. This wasted time can make roaming from one AP to another much longer, disrupting the user experience.
DFS channels
The embedded wireless module in hospital beds and expensive medical equipment can support all 5GHz channels but includes a note that discourages use of any Dynamic Frequency Selection (DFS) channel. DFS channels carry a special requirement that the AP and all clients using a channel must abandon it temporarily if a radar signal is detected
The process of abandoning a channel and moving to a different one takes valuable time, which would disrupt communications. Therefore, if you had planned on enabling all of the U-NII-1, U-NII-2, U-NII-2 Extended, and U-NII-3 bands to take advantage of the greatest number of available channels, you might be disregarding the recommendation. Instead, you should consider disabling the “U-NII-2 and U-NII-2 Extended bands to avoid using the DFS channels“.
Disabling Data rates
You should also pay attention to the data rates supported by each device type. As you will learn later in this book, you will want to disable some of the lowest data rates on the APs to limit the size of their RF coverage or cell areas
As long as each device type can still support the remaining higher data rates that you will leave enabled, it should operate successfully. However, you might have some legacy or unique devices that require some lower data rates. If you disable those rates, the devices will not be able to operate at all.
Transmit power levels
A higher transmit power generally allows a wireless device to send its signal over a longer distance. This is because stronger signals lose strength more slowly as they travel through space (a process called path loss).
Higher transmit power helps with following:
-Increasing communication distance between device and AP
-Helps signals penetrate obstacles (walls, furniture, etc.)
-Can improve signal-to-noise ratio (SNR)
-improves signal reliability at the edge of coverage – increasing transmit power on an access point (AP) can push the edge of coverage further, but only to a limited extent, because Wi-Fi coverage is two-way
When you raise the AP’s transmit power:
Devices farther away can still hear the AP’s signal
The usable coverage boundary moves outward
Signal reliability improves near the previous edge of coverage
So in that sense, yes—the edge of coverage shifts outward.
The key limitation (client transmit power) – 2 way
However, client devices (phones, laptops, tablets):
usually transmit at much lower power than the AP
may not be able to reply back reliably from that new outer edge
This creates a situation where:
-the client can hear the AP
-but the AP cannot hear the client clearly
Wireless communication is two-way. Increasing transmit power on only one device does not fully extend usable range unless the receiving device can respond with sufficient power too.
Different device transmit powers due to battery conservation
Wireless devices can also differ according to their RF capabilities. For example, the transmit power level of one device might be very different from that of another device. This variation is usually due to the form factor involved. If a device is relatively small, such as a wireless phone or voice communicator, its battery is probably small too. The device may limit its transmit power to a lower level so that it can conserve its battery power throughout the day.
Ideally, the device and AP transmit power levels should be equal or symmetric so that the signals can travel and be received in both directions.
Receiver Sensitivity
When a client device is located near the edge of an AP cell, it must be able to receive the AP’s signal at a level that is above the threshold its receiver requires to interpret the signal. That threshold is known as the receiver sensitivity.
Higher data rates need higher RSSI and SNR
As a rule of thumb, increasing data rates use more complex methods to encode and modulate the signal. This, in turn, requires higher signal-to-noise ratios (SNRs) and receive signal levels that are higher than the sensitivity threshold
Client Density
Client density is essentially the number of devices per AP. As more clients join an AP, they must all compete for the available airtime on the channel. The end results are poor performance and unsatisfactory user experience. The design should provide an adequate number of APs such that the user population is distributed across the APs
Crowded venues may require more dense wireless support, if only to distribute the airtime and bandwidth to users who may be downloading or viewing identical content for a class.
WIPS
Cisco WLCs offer a rich set of WIPS signatures that are used to match against traffic passing over a WLAN
Applications on clients
You also have to ask the nature of applications that will be used by clients, if client is using realtime services such as voice, video, VDI or heavy file transfer, then we need to think on how each client running these applications will affect the airtime in peak times
A dense population of bandwidth-intensive applications might starve users of available bandwidth
Lower data rates, longer distance – Higher data rates, shorter distance
The main factor in a data deployment is the minimum data rate supported by each AP. Lower data rates can be successfully used at greater distances from the AP because simpler modulation and coding methods are used to carry the data over the air. Such signals are easier to interpret at the receiving end
Higher data rates use more complex methods and are more sensitive to the signal and noise levels. Therefore, they are dependable when the signal is stronger, nearer to the AP.
In Design A, a low data rate of 6Mbps is acceptable, while Design B raises the rate to a minimum of 24Mbps. Notice that the AP cell sizes are considerably larger in Design A than in Design B. That means only four APs can cover the area in Design A. To cover the same area in Design B, eight APs are required.
With the focus on RF coverage, a low minimum data rate translates to a lower number of APs required. As the minimum data rate is raised, more APs are needed.
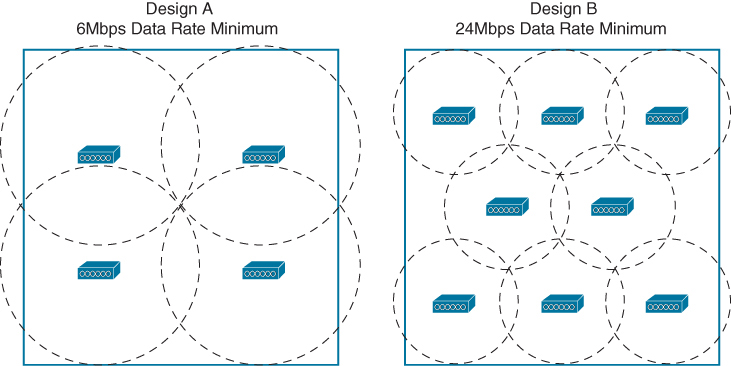
Reducing the AP cell size has one more effect. The number of clients associated to each AP is reduced, even if the clients are densely packed into the area. Therefore, a higher density of users can best be served by a higher density of APs. AP cell size and density are topics that are covered in greater detail in Chapter 5.
Voice/Video Deployment Model
Voice or video devices will usually have a limit on the acceptable amount of jitter. As well, these devices will need seamless roaming so that the voice or video calls are not dropped or interrupted as the clients move around.
A source of interference can cause packet errors that interrupt a voice or video stream.
Other factors like
-poor radio frequency (RF) coverage (having low or poor access to channel)
-high channel utilization (too many devices on a single channel)
-excessive collisions (contended airtime and high channel use)
can also impede good data throughput and integrity
If roaming has problems and is not smooth then during the roaming process, wireless frames might get dropped
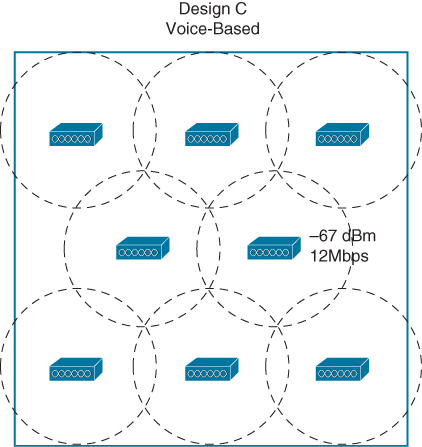
An AP deployment model that is focused on voice and video application traffic is not too different from a data deployment
For voice minimum mandatory data rate of 12 or 24Mbps, with boundaries at −67 dBm.
Location Deployment Model
Sometimes real-time location services (RTLS) are needed to automatically determine the physical location of wireless devices. RTLS can be used to
“to track the locations of wireless clients”
“track assets like healthcare equipment”
“to track rogue devices that might be causing problems on the network”
“to locate sources of wireless interference”
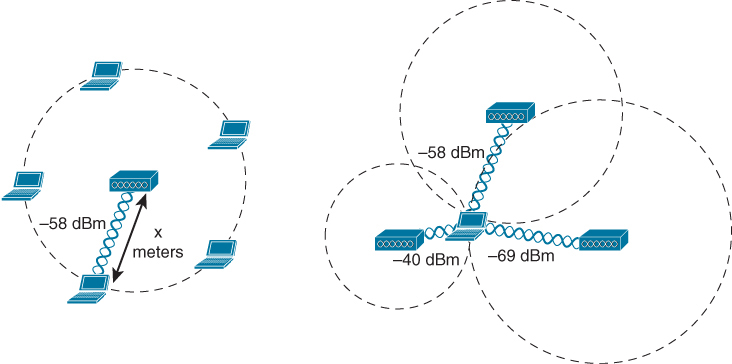
A device is located by measuring its RSSI from several APs that can receive its signal, then using the multilateration technique to compute its physical location relative to the receiving APs
If a single AP is used to determine a device’s location, the distance from the AP to the device can be estimated by the RSSI and attenuation from free space path loss. However, the device could be located anywhere along a circle surrounding the AP, If more APs are added to the computation, the number of possible locations can be greatly narrowed. Ideally, a wireless design should have enough APs distributed across the covered area such that a signal from any device location can be received by at least three APs
RFID Tag
If an object has no 802.11 capability, a small 802.11 RFID tag can be attached to it. The tag periodically transmits an 802.11 probe request frame to announce itself to any listening APs, allowing its location to be computed. Usually RFID tags transmit at the lowest mandatory data rate so that their signals can reach the greatest number of APs. Depending on their capabilities, some tags can send a payload of information such as push button and so on
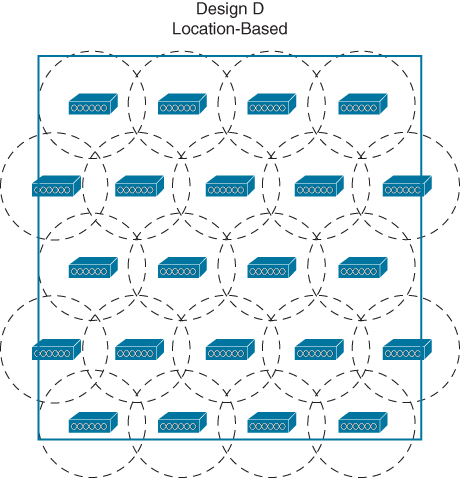
Typical location-based AP deployment models do not focus on any requirements other than RF coverage but there is one special requirement, some of the APs are required to be located around the perimeter of the coverage area because of that even when a tracked device is located near an outer wall, its location can be computed accurately
If a customer wants to use a combination of wireless devices that does not fit one specific model, such as laptops and tablets, along with wireless phones and RFID tags. Which model should drive your wireless design? You can combine all three to form a hybrid model that can support all of the devices.
Wireless Interference
Wireless interference refers to unwanted radio frequency (RF) signals that disrupt or degrade the performance of a Wi-Fi network
Rogue devices
There are different kinds of rogue devices:
- Rogue AP: An employee plugs in a personal Wi-Fi router to get better signal at their desk which simply connects into the switch, Attackers can connect through it and bypass enterprise security controls.
- Evil Twin AP: A malicious AP pretending to be your legitimate network, Clients connect unknowingly and attackers capture credentials.
- Rogue Client: An unauthorized wireless client connected to your infrastructure, such as third party device or BYOD device somehow connected to Corp SSID
Chapter 2. Conducting an Offsite Site Survey
Radio frequency (RF) propagation depends on the environment, and if you do not know the environment, you cannot possibly design your network properly. This does not mean that you should rush onsite with site survey tools. The site survey starts before traveling
Type of building
Some of the first elements you should collect in preparation for a site survey are a map and building materials
Type of business / building
Covering an office building is not the same as covering a warehouse, and knowing the line of business and activity
Number of APs – Density vs Coverage vs Application
you should have a clear idea of the type of coverage needed, data, real-time applications, and location-based services, this will help in determining the number of APs needed
Knowing the number of APs will help you plan how much time it will take to survey the facility.
Attenuation
The loss of signal strength is more pronounced as the signal passes through different objects, Therefore, knowing the expected obstacles will help you estimate the size of each cell.
Transmit power and signal propogation / Attenuation
The power of AP radio signals is expressed in dBm. dB stands for decibels, a unit to measure relative power on a logarithmic scale, and m stands for milliwatt, m or milliwatt helps scale or measures the transmitted or received power, using 1 milliwatt as the reference value.
Because the dB scale uses logarithms, it is not linear, doubling the transmit power is represented by a gain of 3 dB (and, symmetrically, halving the power is represented by a loss of 3 dB)
Increasing the power by 10 is represented by adding 10 dB, and dividing the power by 10 is represented by subtracting 10 dB
For example, a transmit power of 20 mW can be represented as 13 dBm. This is because you start from a 1 mW reference, which is expressed as 0 dBm, because you have nothing more or less than the reference starting point. You then multiply that reference power by 10, thus reaching 10 mW (or [0 + 10] dBm), and you double that power, thus reaching 20 mW (or [0 + 10 + 3] dBm).
For example, the AP radio is “set” to 13 dBm
But attenuation is measured in dB and not hte dBm
Each obstacle and each material absorb some of the signal. In the Cisco world, there is a common reference table
| Object in Signal Path | Signal Attenuation Through the Object |
|---|---|
| Plasterboard wall | 3 dB |
| Glass wall with metal frame | 6 dB |
| Cinderblock wall | 4 dB |
| Office window | 1–3 dB |
| Metal door | 6 dB |
| Brick wall | 8 dB |
| Concrete wall | 12 dB |
| Phone and body position | 3–6 dB |
| Phone near field absorption | Up to 15 dB |
Different countries use different building practices. A brick wall that represents 8 dB attenuation in one country may be labeled as 12 dB attenuation in another because the brick is different—thicker, with additive isolating material, with or without inner air chambers, and so on.
Keep in mind that each site surveyed will have different levels of multipath distortion, signal loss, and signal noise.
Enterprise Office
Enterprise Wi-Fi environments show two main trends:
Increase in devices: Workers commonly get laptops (wired and fixed stations become less common), and users also bring phones and tablets. The wireless space becomes crowded with devices
Throughput reduces as more clients are boarded
You should also explain to your customer that a wireless network is designed for a target throughput and that adding throughput is not just about adding more APs later. Adding more throughput typically means conducting a new site survey. If any change in user density is expected, it is better to take this possibility into account early.
Large open spaces & Atrium

Providing coverage in such an open space might prove challenging. The signals from many APs around the atrium, on different floors, may bleed through and travel far in the open space. The result may be that too many APs are detected from the atrium area. You may have to plan ahead and take this difficulty into consideration, positioning the APs far from the atrium area and using only one or two APs specifically to cover the open space.
Another type of issue may be encountered in large meeting rooms or auditoriums where you may expect a very high density of users (perhaps several hundreds of users). Because of the size of this type of room, using standard APs with internal antennas is often not feasible. You may have to come up with creative solutions, such as using directional antennas or a high density of APs set to low power.
Client floors in the building
You may need to know how many floors in a building are leased by client, in these cases you should expect RF neighbors you cannot control. They may use all possible channels and be set to maximum power. You should be ready to work around these limitations
Healthcare
Healthcare site surveys are often time-consuming because almost every hospital is a multistory building with numerous small rooms.
Hospitals also have special rooms, like trauma and X-ray areas, where the walls might be lead-lined and completely stop RF signals.
In addition, hospitals have restricted access policies that apply to some areas, such as surgical rooms and clean rooms. It is often difficult to obtain access to these rooms, and when you do, you may not be allowed to carry your laptop. Even so, you may still be expected to provide wireless access inside these areas.
Healthcare environments often require the WLAN to support a large number of application types: paging, voice, a wide range of data applications (such as mobile carts and patient monitoring devices), and location services. These applications may be critical for keeping patients alive, and your design should ensure optimal signal to every corner of every room, even when all doors are closed.
Hospitals also use laptops on wheels (also called workstations on wheels, or WoWs) that are pushed
They may be transmitting while moving, requiring you to design your network by taking into account roaming paths and required throughput. Hospitals also often provide public Internet access for their patients and visitors, and this service may compete with the staff network.
Another common use case for wireless in healthcare environments is location tracking. This tracking may be used for assets (for example, blood pumps, beds, wheelchairs, and other assets
Hotels
Hotels are much like hospitals in their building construction and configuration (that is, usually multiple floors with many rooms). Beyond guest Wi-Fi, hotels have started using WLANs to support devices for taking inventory of things such as minibars, staff location, equipment status, and more
Hotels want to offer their guests fast, reliable Internet access, which means fewer users per AP. This can easily be achieved in guest rooms. However, hotels often have restaurants and retail and convention areas, where user density may be much higher
These are usually public places and thus susceptible to theft and vandalism. A common requirement is to properly secure APs to ceilings or walls or to hide them above the ceiling.
Guest should be able to connect to the wireless network without requiring external assistance, which means that connection security is often very limited to allow for compatibility with the largest possible number of devices
Hotels also have many of the same concerns as hospitals regarding aesthetics. APs may need to be hidden in the walls or ceiling, where possible, or behind elements of the furniture.
Education
In high schools and universities, personal devices are common, and many students carry several devices. Most of these devices will be configured to connect to the school network and will associate as soon as they are in range. They may then perform automatic updates and stay connected all day long, even if the student is not actively using them. The density of devices may place a serious strain on the wireless infrastructure and may force you to set up a security policy by which each student has credentials, allowing one session at a time.
You may also have to implement congestion policies. A common design is to account for 25 to 30 students (not devices) per AP, which may mean that in some cases you need more than one AP per classroom.
School buildings present the same issues as large office buildings and hospitals. The survey needs to be conducted with 3D in mind, as signal will bleed through floors and ceilings
You are also likely to need to deal with large atriums and large auditoriums with high student density, where you may face too much signal from too many APs. Here again, you may need to use directional antennas to increase the AP density without creating too much interference.
National Electrical Manufacturers Association (NEMA) enclosures with enclosed locks can help prevent tampering or theft. You can use these enclosures in locations where APs cannot be hidden easily or in truly high-risk areas
Retail
Stores must also often comply with specific regulations, such as those from the Payment Card Industry (PCI). These requirements may create additional constraints in the type of encryption and the characteristic of the Wi-Fi cells deployed for the staff. Another concern in the retail industry is the close proximity of the store to other RF devices. Some locations might stock and display RF devices in the store, such as satellite systems, baby monitors, and cordless phones. Others may use non-Wi-Fi cameras or cordless phone systems. Many of these devices might operate in the 2.4GHz range, and some might operate in the 5GHz range. APs should not be installed next to this type of equipment because they typically have a higher transmitter power.
Keep in mind that coverage may be needed on loading docks or inside trucks at the loading dock. Depending on the WLAN design, there might be enough RF coverage extending to the outside of the buildings to accommodate this need, but it should be factored into the design. You need to observe customer behavior. If staff scan goods from inside the trucks while loading or unloading, you need to plan for coverage accordingly. Trucks may have metallic trailers, and providing coverage inside a truck might require a directional antenna. The goods may absorb the signal, so you might need to place your APs strategically to work around the absorption issue. Here again, observing customer habits is key to a good design.
Warehousing
There might be a limited number of users during the day, but when a shipment comes in (or when multiple shipments come in at the same time), many or all users might be operating at the same time. Coverage areas are generally large and subject to a lot of multipath distortion or RF interference because of concrete floors, metal roofing, and metal shelving. Cell size is more important than data rates because warehouse applications are generally transaction driven, with small packet sizes. Cell coverage overlap needs to be from 10% to 15%. The usage is not very high, but the users are highly mobile and must roam often.
Stock levels vary over time
A warehouse at a 50% stocking level has a much better RF footprint than it has at 100%. Goods such as lead-based paint will reflect the signal, and paper or pet food will absorb the signal and reduce the usable cell size
if you plan to install an AP in a harsh environment, you may need to put it in a protective box, NEMA 4X rating ensures protection against corrosion, windblown dust and rain, and splashing water and hose-directed water; this is the right level of protection for an AP.
Outside the United States, other ratings agencies may provide equivalent ratings. For example, the International Electrotechnical Commission (IEC) has released the standard IEC 60529, which defines the protections offered by casing devices. Under this standard, IP66 provides the same level of protection as NEMA 4X.
RF regulatory bodies and transmit power / channel use
each country has its own regulations governing the RF spectrum
In the United States, the Federal Communications Commission (FCC) determines what frequencies and transmission power levels can be used
Europe and some other countries follow the specifications of the European Telecommunications Standards Institute (ETSI).
When implementing a wireless network, you must make sure that the AP transmissions comply with local regulations.
5GHz Band Channel Allocation
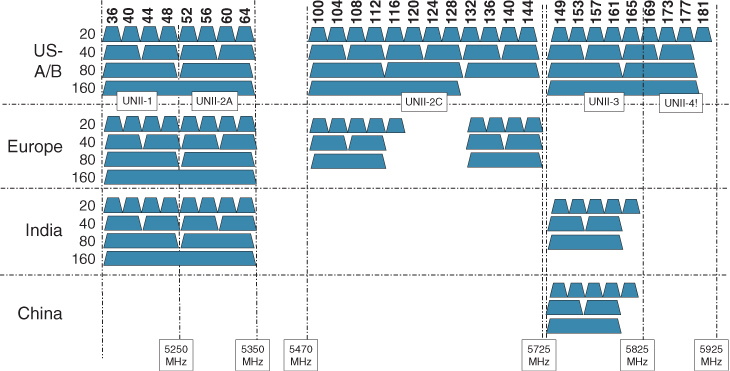
FCC regulates the effective isotropic radiated power (EIRP), which is the total energy radiated out of the AP antennas on a particular channel.
Spatial stream
Instead of sending data one piece at a time, modern Wi-Fi splits data into parallel streams and sends them simultaneously. This increases speed without needing extra bandwidth.
1 spatial stream → 1 data signal → slower
2 spatial streams → 2 parallel signals → roughly double speed
4 spatial streams → 4 signals → even faster
Think of spatial streams like extra lanes on a motorway 🚗: More lanes = more traffic moving at once.
When you use an access point that has multiple radio chains (for example, with four possible spatial streams), the EIRP represents the combined energy of all chains
A chain = one hardware signal path that can transmit or receive one spatial stream
A 4×4 MIMO access point has: 4 transmit chains, 4 receive chains supports up to 4 spatial streams. That means it can send four separate data signals at the same time (if the client also supports them).
A radio chain (often called an RF chain) is a complete transmit/receive signal path inside a wireless device. Each chain includes its own electronics that generate, process, and send one independent radio signal to an antenna (or antenna port).
This means that each radio chain may transmit at higher or lower power, depending on which other radio chains are also transmitting. The AP makes that change automatically and dynamically on a per-frame basis, per frame because air acts as half duplex
This also means that the energy radiated per unit of frequency (for example, per MHz) is lower when you use a larger channel (such as 80 MHz) than when you use a narrower channel (such as 20 MHz), as the total amount of radiated energy needs to stay the same regardless of the channel width.
The key idea here is power is fixed, but bandwidth changes — so the power per MHz decreases when the channel gets wider
So if the same total power is spread across: 20 MHz → more power per MHz
80 MHz → less power per MHz
its more like you are qasting energy by sending on 20 Mhz frequency
EIRP is calculated by adding the transmitter power (in dBm) to antenna gain (expressed in isotropic antenna or decibel referenced to isotropic antenna [dBi]) and subtracting any cable losses (in decibels):
EIRP = Tx power (dBm) + Antenna gain (dBi) − Cable loss (dB)
There are many regulatory rules, and you are supposed to know them. Most importantly, you need to keep in mind that your design and survey should incorporate the regulatory settings matching the country where the network is to be deployed. Do not use “default” settings or “U.S. settings” when designing a network for a European country (and vice versa). Always look for the settings that activate the appropriate regulatory domain in your AP, WLC, survey laptop, or site survey software. Otherwise, your conclusions may be invalid (and as a professional, you may be liable if the system you designed exceeds the local maximums).
Choosing the Right Survey Type
Surveys can be divided in two types: offsite and onsite
The goal of an offsite survey is to evaluate the building blueprint and estimate the number of APs needed.
Blueprint study: In this type of study, you study the floor plans to identify areas that require specific focus, such as areas that are hard to cover because of their shape, building material, or obstacles (such as machines); thinking in 3D terms will help because of attenuation from lead and metal, ir concrete divisions or walls etc, areas of high user density; etc
Predictive survey: In a predictive survey, you use a tool to position APs on a map representing each floor to cover. In some cases, you can account for the obstacles (such as walls) that you expect to find onsite, expected service (voice and so on), and user density. You can use these tools to estimate an AP count and identify areas where special antennas may provide the coverage you need.
Types of onsite surveys
Walkthrough: In a walkthrough, you walk through the facility and visually inspect the location. A walkthrough is important to complement the blueprint study and identify areas that require special consideration. A walkthrough is also important for observing users’ behaviors when available (for example, people cutting through a meeting room, thus indicating roaming paths that you did not see from the blueprint, people pacing when on calls or video conferences). You can also use this time to exchange and gain useful insights about how users expect the Wi-Fi network to operate.
Layer 1 site survey: Sometimes called a Layer 1 sweep, this type of survey aims to detect the (non-Wi-Fi) RF activity in the facility. Even if you are covering an office building, you should always perform this type of survey because you are likely to discover non-Wi-Fi devices that will compete for your spectrum. Discovering sources of interference early allows you to address the issue before it blocks your design. You can inquire about the interferers and maybe have them removed, or at least you can account for them in your channel plan and your performance projections.
Layer 2 site survey: This is what most people think of when referring to site survey, but there are two subtypes: passive surveys (also called validation surveys), where you assess the presence of existing Wi-Fi networks in the environments, and AP-on-a-stick (APoS) surveys (sometimes called active surveys), where you install temporary APs and evaluate their coverage area. We will cover them more in detail in Chapter 3.
Post-deployment site survey: You conduct this type of survey after the Wi-Fi network you designed has been deployed in order to test the coverage and performance. This survey is critical to the success of your design and is covered in Chapter 12, “Implementing Multicast.”
A Survey of Wireless Planning Tools
Hundreds of tools claim to help design Wi-Fi networks. They tend to offer multiple functions, and you will see people using a single tool for all tasks. However, keep in mind that these tools should be divided in two categories, based on their goals
Offsite predictive tools: These tools allow you to upload a map, specify its scale, and project the number of access points needed. Some tools are generic; others allow you to choose the AP vendor and model, specify the user density, draw obstacles, specify the target application, set the expected AP height, and so on. Some of these tools come in the form of an application running on a laptop or tablet (local installation), some require a server installation (LAN server), and others are completely online (cloud and web access). Sharing the project becomes easier as you move toward the “fully online” categories.
Onsite survey tools: These tools allow you to run Layer 1 or Layer 2 (validation or APoS) surveys, often with a specific wireless adapter. They can sometimes emulate other clients (for example, major smartphone or tablet vendors and models). Chapter 3 provides more details.
To become a Cisco networking professional, you should know a few tool names and have some exposure to their functions:
Hamina Wireless Network Planner: This is a cloud-based 3D network planning tool that allows you to design enterprise Wi-Fi, private 5G, and wireless IoT networks. You can also use it to plan for switching and cabling (including port and PoE budget). The tool can generate coverage maps, bills of materials (BoMs), and browser-based and PDF reports.
Ekahau Pro: This is a professional tool that has all the functions described so far, and it comes as an application you install on a laptop. Although primarily intended for onsite surveys, Ekahau Pro incorporates a planning mode (supporting obstacles, application types, user density, and AP models—including most Cisco APs). A lighter version exists for tablets (Ekahau Survey for iPads). A cloud version is also available (Ekahau Cloud) to share projects.
Yagna RF Wi-Fi site planner: This is a simple online planning tool that supports most Cisco APs, obstacles, application types, user densities, and more. It integrates with Google maps and can also generate BoMs.
Chapter 6. Designing Radio Management
Lowering AP cell size can be done in two common ways in Wi-Fi design:
Reducing the lowest mandatory data rate
Reducing the transmit power
They both shrink coverage—but they behave very differently in practice.
Reducing cell size by increasing lowest mandatory rate
When you increase the minimum mandatory data rate (for example from 6 Mbps → 12 Mbps → 24 Mbps), you effectively shrink the usable coverage area because slower modulation schemes (which travel farther) are no longer allowed.
What actually happens
Clients:
must maintain a stronger signal
roam earlier
cannot stay connected at long distances
The AP:
still transmits at the same power
still physically reaches far distances
but refuses low-speed connections
So this is a logical cell size reduction, not a physical one.
Why engineers do this
Benefits:
Faster roaming
Less sticky clients
Higher airtime efficiency
Better VoIP/video performance
Reduced co-channel contention
Think of it as:
“Clients can still hear the AP—but they’re not allowed to stay connected.”
Reducing cell size by lowering transmit power
Lowering transmit power reduces the actual RF footprint of the AP.
Now: fewer devices can hear the AP at all
interference range shrinks
contention domain shrinks
spatial reuse improves
This is a physical cell size reduction.
Think of it as: “Clients cannot hear the AP anymore beyond this boundary.”
Suppose you need to provide wireless coverage in a rectangular-shaped building. For simplicity, assume that the building has one floor and no interior walls or other objects that would affect RF propagation. Using the information you have learned from this book, you decide to use six APs and locate them such that they form a staggered, regular pattern.
So far, you have considered the layout pattern and an average cell size, but you still have to tackle the puzzle of selecting the transmit power level and channel number for each AP. The transmit power level will affect the final cell size, and the channel assignment will affect co-channel interference and roaming handoff. At this point, if all the APs are powered up, they might all end up transmitting on the same channel at maximum power (100 mW, for example).
Each of the AP cells overlaps its neighbors by about 50 percent, and all the APs (and their clients) are fighting to use channel 36
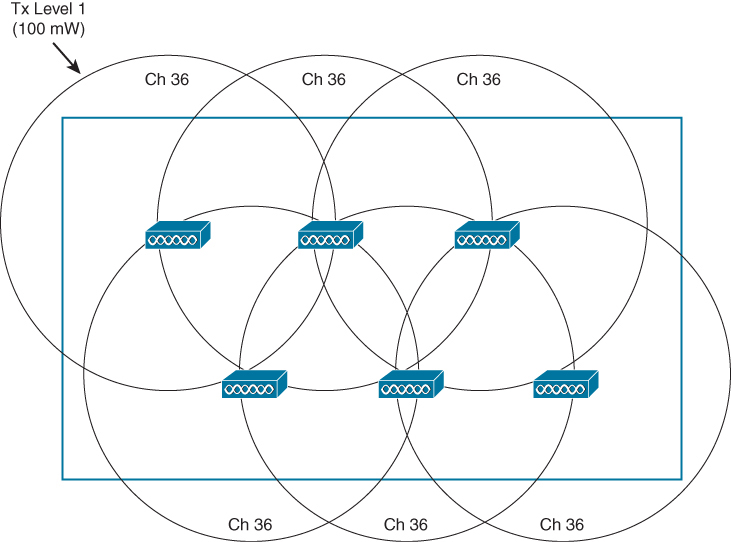
Where do you begin to prevent such mayhem? Because the AP locations are already nailed down, you can figure out the transmit power level that will give the proper cell overlap. Then you can work your way through the AP layout, choosing an alternating pattern of channel numbers. The example with six APs might not present a daunting task, but a large building with many APs on many floors is an entirely different situation.
Do not forget to repeat the transmit power and channel assignment tasks for the 2.4, 5, and 6GHz bands, as many APs have multi-band radios.
Remember that only the 5 and 6GHz bands are capable of supporting wide channels. Also remember that your choice of channel width also affects the available number of non-overlapping channels you can assign to the APs.
Suppose you happen to notice one day that an AP has failed. You could always reconfigure its neighboring APs to increase their transmit power level to expand their cells and cover the hole left by the failed AP.
One day in the future, you might identify an area where a higher density of users begins to gather. If you decide to introduce additional APs to distribute the client load, you will need to revisit the entire configuration again to make room for new cells and channels. As a result, you will probably need to rework the channel assignment on all of the APs to accommodate the new APs and their channels
Did your life as the wireless LAN administrator just become depressing and tedious? Cisco Radio Resource Management (RRM) can handle all these tasks regularly and automatically. RRM consists of several algorithms that can look at a large portion of a wireless network and work out an optimum transmit power level and channel number for each AP
If conditions that affect the RF coverage change over time, RRM can detect that and make the appropriate adjustments dynamically. The sections that follow explain each of the mechanisms and algorithms used by RRM.
RRM
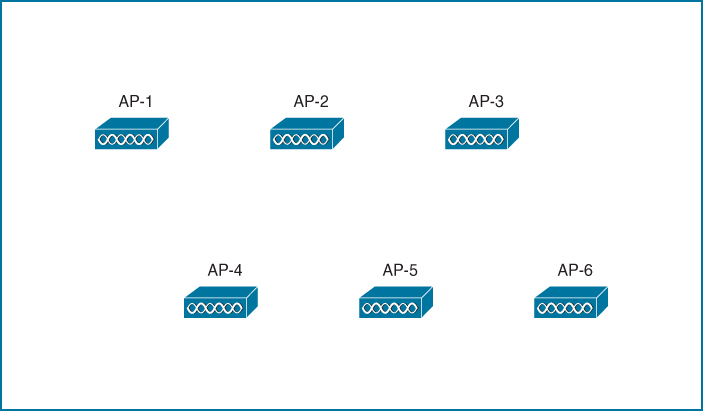
RRM uses the Network Discovery Protocol (NDP) to advertise each AP’s presence. If an AP’s advertisements are received by other APs, those APs must be in proximity to each other.
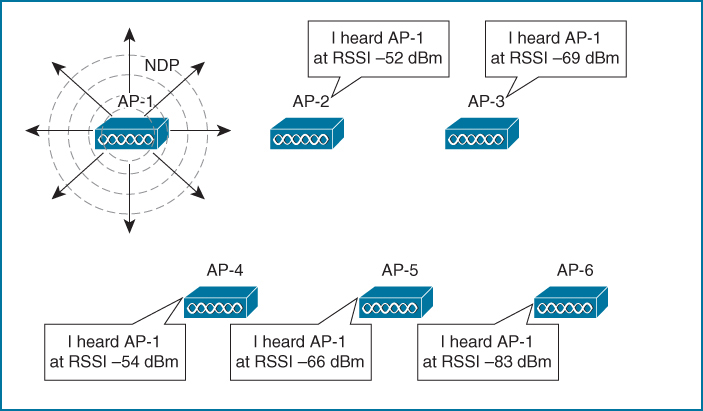
AP-1 is transmitting NDP messages to announce itself. Each of the other APs is able to receive AP-1’s advertisement and measure its received signal strength—one of the components necessary for RRM calculations.
NDP advertisements are sent to the multicast address 01:0B:85:00:00:00, which is recognized by all other Cisco APs. The messages are transmitted at the highest power allowed for the channel and band
RRM always know the strength of the signal as it leaves the AP’s antenna (because NDP are sent at the highest power for that channel). Then when that signal is received by other neighboring APs, RRM can use the RSSI to gauge the free space path loss between the transmitting and receiving APs.
NDP advertisements are transmitted using the lowest data rate possible in the band—regardless of whether or not that data rate has been enabled for use. For example, 1Mbps is always used in the 2.4GHz band and 6Mbps in the 5GHz band. By using the lowest data rate, the advertisements are more likely to be intelligible farther away from the transmitting AP and in noisy environments.
AP collect the advertisements it receives and report the results to the wireless LAN controller (WLC), WLC RRM can then compute any adjustments to the transmitting AP’s power level to tune its cell size appropriately.
RRM running on WLC can then compute any adjustments to the transmitting AP’s power level to tune its cell size appropriately, RRM also evaluates the interaction between APs on the channels they are using. Then it can compute and make changes to both transmit power levels and channel assignments.
To reach neighboring APs that might be operating on any arbitrary channel, each AP must transmit its NDP advertisement on every channel it is configured to support. It does this by waiting for an idle period on the current channel and then quickly tuning to a different channel and sending the NDP frame there. It must work through the entire set of channels over a period of 180 seconds. DFS channels are the exception; an NDP frame will be sent on a DFS channel only if the AP is currently the channel master and has determined that no radar signals are present.
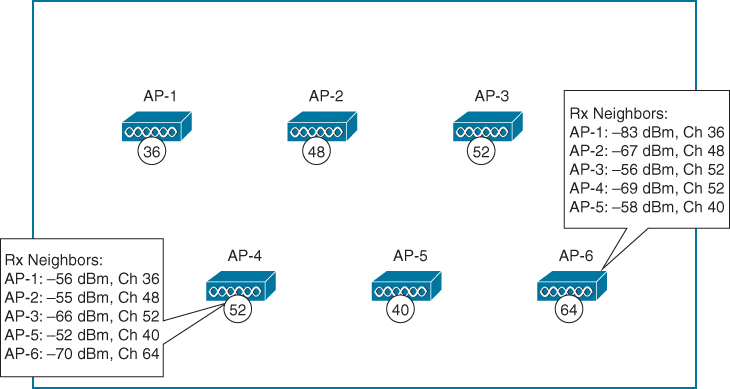
Each AP must include its normal operating channel number in its NDP advertisement so that other APs will know its channel assignment
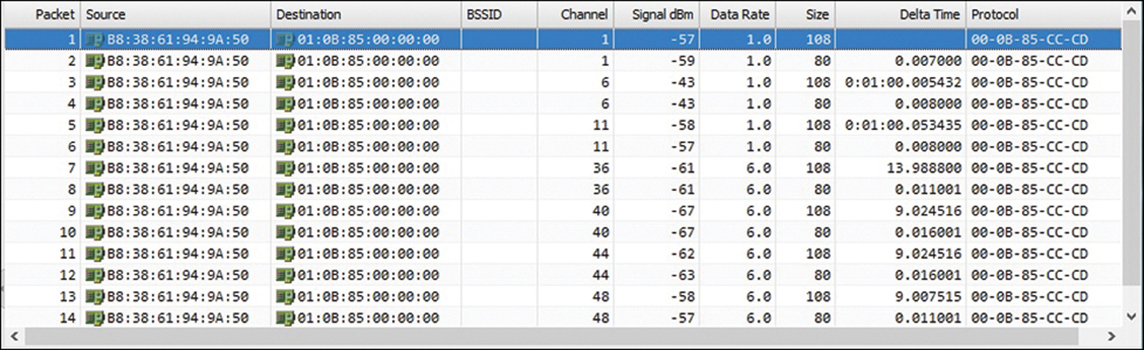
over-the-air packet capture of NDP advertisements that were transmitted by a single AP
Channel column and how the AP has cycled through the channels sequentially over time. It even cycled through the 2.4 and 5GHz bands.
Notice how the neighbor lists also contain data that can indicate co-channel interference. For example, AP-4 is operating on channel 52 and its neighbor list shows AP-3 also operating on channel 52 with a reasonably strong signal strength.
Once the APs send their neighbor lists to the WLC, RRM can compute any adjustments needed to form a more effective channel assignment layout.
Each AP maintains a list of NDP advertisements received from up to 34 neighbors due to small ASIC limits. To maintain some stability in the data, entries are automatically pruned and removed if no NDP message has been received from a neighbor after 15 minutes has elapsed
NDP advertisements contain the following information about the sending AP:
- Radio ID: Designates which radio (2.4GHz, 5GHz, 6GHz) sent the frame
- Group ID and hash: Designates the logical group name where the AP is a member
- Encryption: Key information if the NDP message is encrypted
- IP address: The address of the WLC where RRM algorithms are running
- AP channel: Normal operating channel
- Message channel: Channel used to transmit the NDP message
- Message power: Transmit power level (dBm) used to transmit the NDP message
- Antenna pattern: The transmitting antenna pattern used
Every Cisco lightweight AP is expected to send periodic NDP advertisements. If a beacon frame is received from an AP that has not sent an NDP advertisement, the wireless intrusion detection system (WIDS) running on the Cisco WLC will flag that AP as a rogue device.
RF Groups
RRM only works on APs in RF Group, all of the APs that belong to an enterprise can be contained in a single RF group.
Enterprise RF Group
By default, an RF group contains all the APs that are joined to a single controller, If you have multiple controllers, you can include all of their associated APs in the group by configuring the same RF group name on each controller. All of the controllers must be able to communicate with each other through the normal wired network infrastructure.
An RF group can span multiple controllers, but only one of them can run the RRM algorithms for all of the APs involved in the RF group. That means one controller must be elected as the RF group leader.
The group leader can be elected automatically or through static configuration. In an automatic election, the WLCs exchange information about each other. The WLC with the highest-performing platform and the greatest AP license will become the group leader
If there is a tie among identical controllers, the one with the highest IP address will win the election
Each band has its own separate instance of RRM and its own RF group leader. After the group leader elections, you may see a single controller acting as group leader on all bands
or one controller as group leader on one band and a different controller as group leader on another band.
AP send AP neighbor list updates to RF group leader for that RF where RRM algorithm runs
If a change is made to one AP, other neighboring APs could be impacted and need adjusting, too, causing their neighbors to be impacted, and so on. In other words, any RF change can have a cascading effect across all APs in a geographic area.
RRM organizes all APs contained in an RF group into RF neighborhoods, or sets of APs that are in close RF proximity to each other. The criteria is simple: Any two APs that appear in each other’s AP neighbor list will become members of the same RF neighborhood, as long as the RSSI is −80 dBm or greater.
An AP will be removed from the neighborhood at the next purge cycle (default 15 minutes or three times the scan interval) only if the RSSI of its received NDP messages drops below −85 dBm.
An RF group can expand across floors in a building, as long as an AP’s signal can propagate through the floor or ceiling and be received by another AP located there.
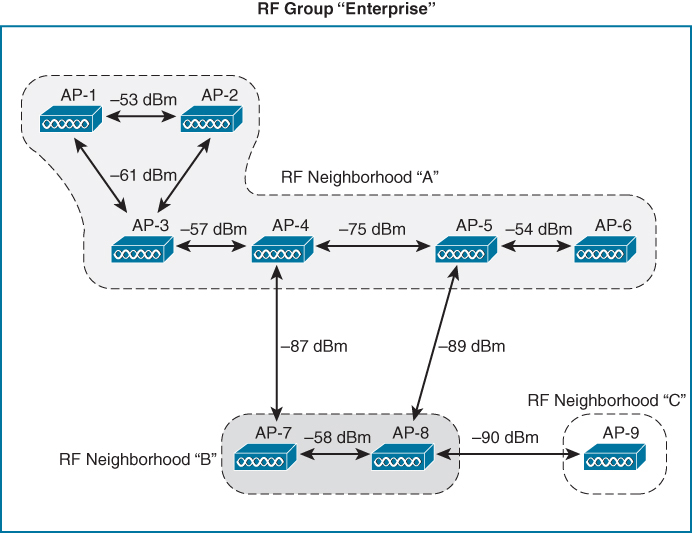
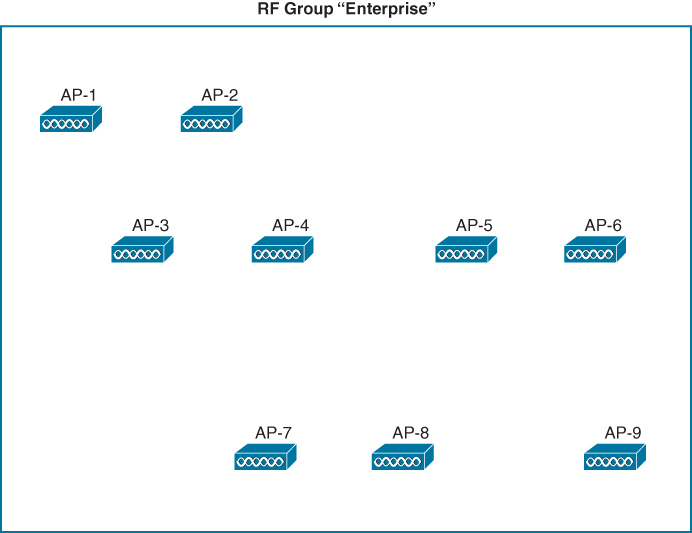
All nine APs are part of the RF group “Enterprise” because they are all under the same administrative control. AP-1 through AP-6 all become members of RF neighborhood “A” because each one can be heard by another member of the neighborhood at an RSSI of −80 dBm or above. AP-7 and AP-8 form a separate RF neighborhood; they have a close RF proximity to each other but not to any members of RF neighborhood “A.” Likewise, AP-9 becomes the sole member of RF neighborhood “C” because it is not close enough to be heard by any APs in the other two neighborhoods.
RF groups and RF neighborhoods have been defined, RRM can proceed with its analysis and computations. Each RF neighborhood can be handled independently because any transmit power or channel changes made to one will be too far away to affect any other.
Transmit Power Control (TPC)
TPC is part of RRM, The transmit power control (TPC) algorithm is one facet of RRM that focuses on one goal: setting each AP’s transmit power level to an appropriate value so that it offers good coverage for clients while avoiding interference with neighboring APs that are using the same channel.
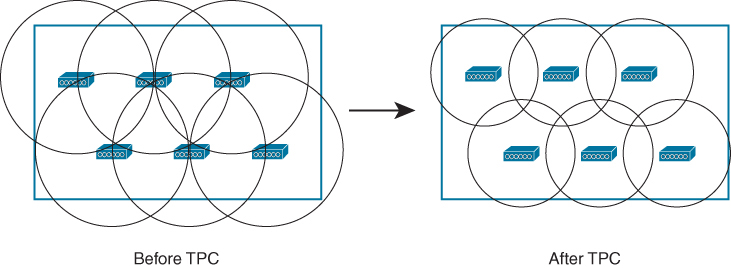
TPC makes ajustments so APs that were once transmitting too strongly and overlapping each other’s cells too much are adjusted for proper coverage, reducing the cell size more appropriately to support clients.
Likewise, if any AP cells are too small and cannot effectively overlap their neighbors’ cells, TPC will attempt to increase the transmit power levels to expand the cell size.
you can see that the APs are arranged in a nice evenly spaced pattern, but the controller cannot see that.
From the AP’s point of view, it can gauge how other APs are impacting its own cell but not how it is impacting others. However, the RRM algorithm is able to compute the impact that each AP has on its neighbors
If an AP’s signal is being received too strongly in other AP cells, the TPC algorithm can configure a lower transmit power level on that AP. Likewise, if other APs have measured its signal as too weak, TPC can raise the AP’s power level appropriately.
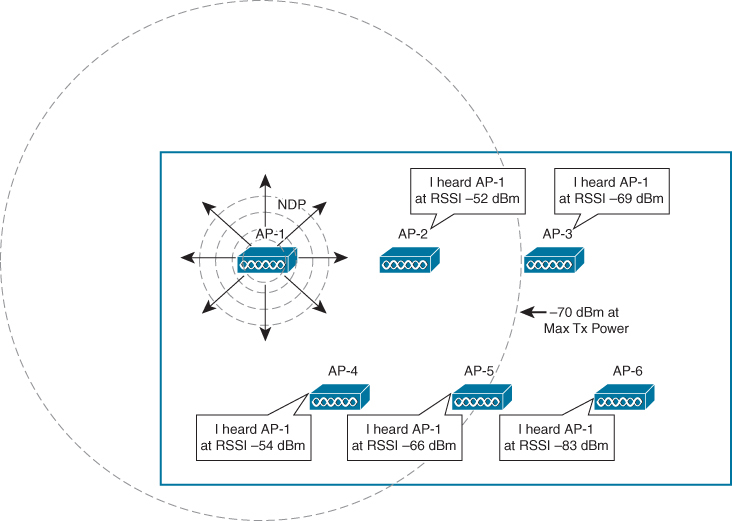
TPC Selects the AP That Has Received the Third Strongest NDP Message from AP-1
To gauge how far AP-1 is capable of reaching into other AP cells, the neighbor list of AP-5 is used because it has the third strongest RSSI recorded for AP-1. The goal is for AP-1 to be received at −70 dBm at AP-5’s location, but it has been received at −66 dBm instead. That means AP-1’s transmit power level can be lowered by 4 dBm from the maximum. Lowering the transmit power of AP-1 by 4 dbm will make AP-1’s measurement -70 dbm at AP-5
this is done so the AP-1’s signal are not too strong and end up creating a massive overlap with AP-5
The same calculation is performed for every AP in the RF group, using the following formula:
Chapter 16. Monitoring and Troubleshooting WLAN Components
Monitoring includes observing load levels (client counts, interface counters, and other volume-related metrics)
Catalyst Center is where many new functions are developed, such as issue root cause analysis and network trend prediction through machine learning, you should make sure to be familiar with this tool as well.
CleanAir shows interferers
Reports on Cisco Catalyst Center
Catalyst Center is aimed at integrating advanced network monitoring and performance analysis functions grouped under the label “Assurance.”
Catalyst Center Assurance continuously collects information about your network and runs reports that can be visualized directly in the Catalyst Center Assurance interface
Dashboards: The dashboards include the
Health component (Overall/Summary, Network, Client, and Applications),
the Issue and Events component (Open, Resolved, and Ignored), and
Wireless Sensors,
Wi-Fi 6,
Rogue and aWIPS, and
Dashboard library.
AI Network Analytics: This section includes Trends and Insights, Network Heatmap, Peer Comparison, Network Comparison, Baselines, and AI-Enhanced RRM
Network Health page displays device counts and status (up/down)
their health level as a measure of elements that can disrupt normal activity such as lost session or authentication issues
Heath can be good (green status), fair (orange status), poor (red status), or unmonitored (grey status). For example, for access points, radio health can be impacted by interferers
health status is displayed as the percentage of devices that have a good health score (that is, a score of 8 to 10)
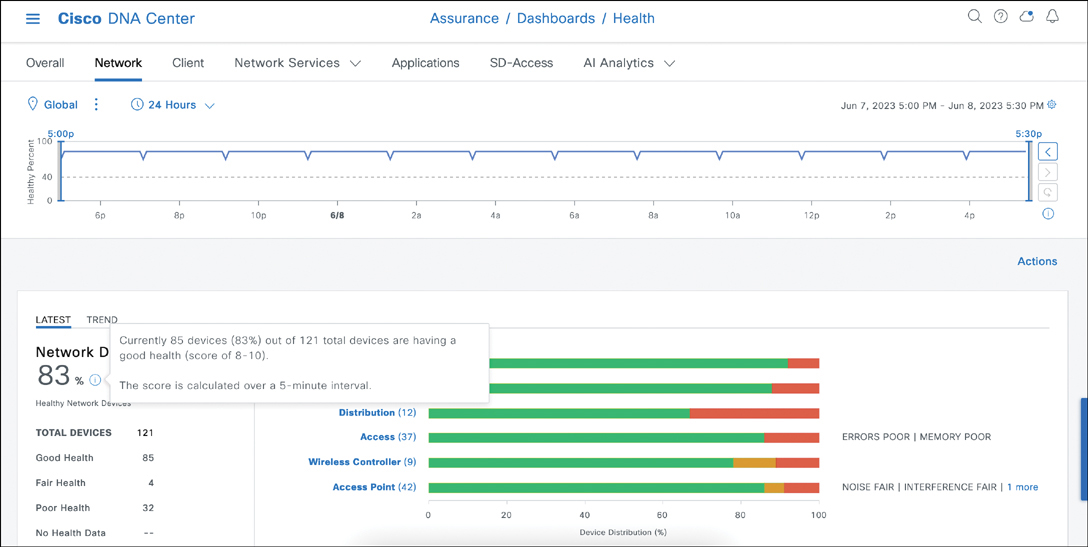
In this case, the “network” dashboard has 42 access points, with a global health score slightly above 80, which means that at least a few APs have a health score lower than 80
If we click Access Points
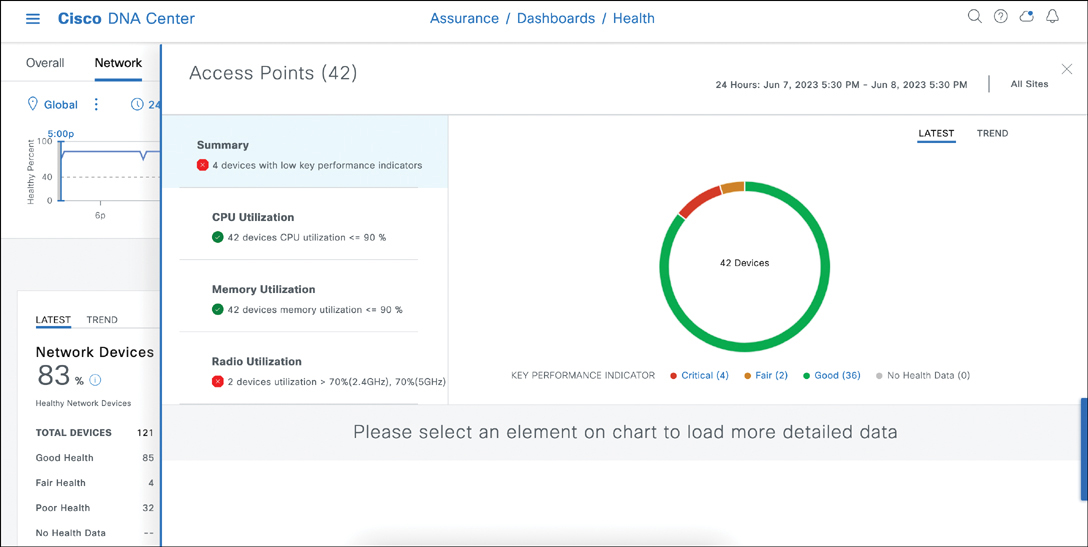
In this example, all 42 APs have a good CPU and memory utilization level, but 4 APs have low key performance indicators, and 2 APs have high radio utilization
You can click each parameter (such as the Radio Utilization zone) to focus the graph on the right on a particular aspect of your network. Then, below the graph, you can click each hyperlink to get additional details
“Latest option”
For each element, the dashboard provides a view of the current state of elements (if you click the Latest option)
as well as counters for the last 24 hours (if you click the Trend option).
At the top of the main Network Health page, you can use the slider to reduce or extend the computed time window
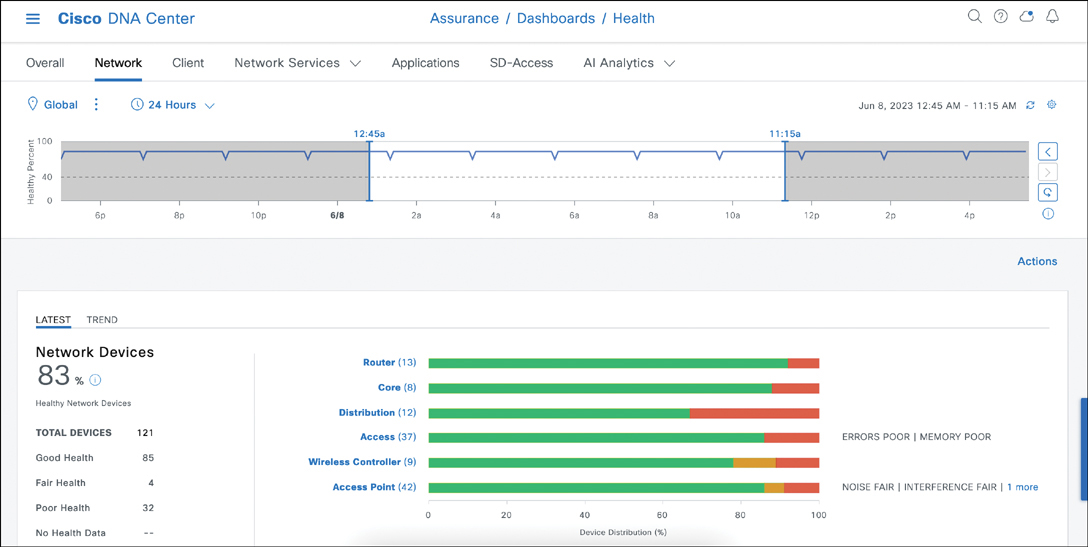
In addition, lower down in the main Network Health page, you can use the Network Devices section to see all your network elements, organized by type (all, routers, core, distribution, access, wireless controllers, and access points) and by health levels (all, poor, fair, good, or no health) because this is health focused view
You can click the Export button to export the devices in table in CSV format.
AI Network Analytics
The dashboards are built by computing performance numbers based on key performance indicators (KPIs) collected from network elements. Catalyst Center also integrates a machine learning engine that uses multiple techniques to predict trends or issues. So there is a machine learning step that improves the results
………….
WLC and Catalyst Center Client Troubleshooting Tools
Once the RF conditions have been validated, it may be time to go back to individual client troubleshooting. A WLC is a network management tool, and one of its functions is to provide visibility into your network and its conditions.
Client Troubleshooting on the WLC
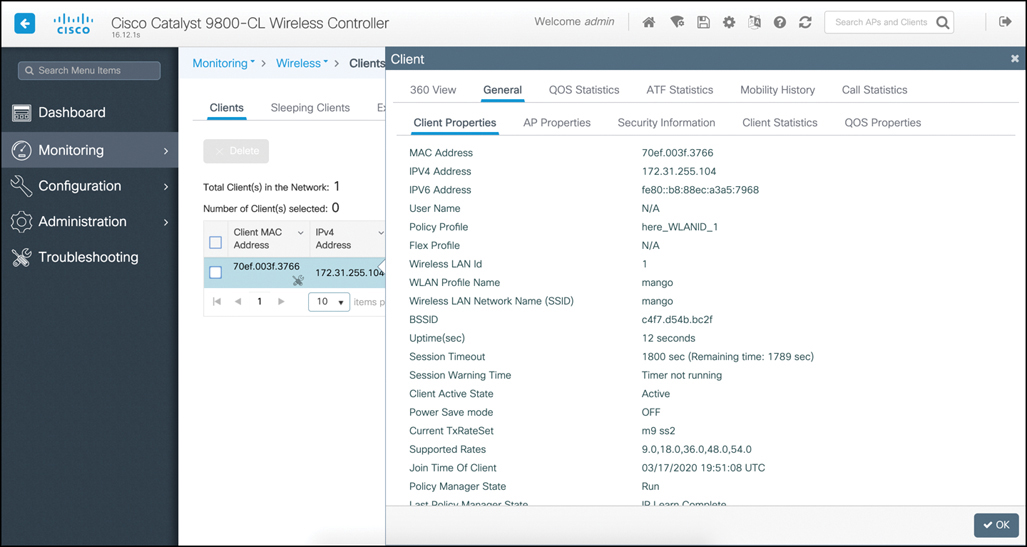
Monitoring > Clients > Details page in the C9800 WLC
The 360 View tab includes general client information along with the top applications list.
The General tab includes five subtabs: Client Properties, AP Properties (client), Security Information (client policy), Client Statistics, and QoS Properties (QoS policies applied to the client)
The C9800 also includes a Troubleshooting page that is intended to help you troubleshoot most client and network issues
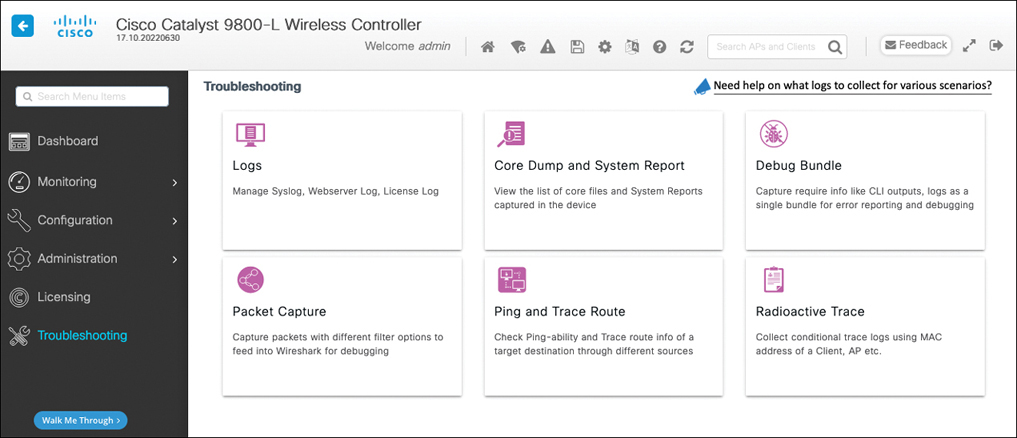
Keep in mind that the logs can provide a view of past client issues.
With the Radioactive Trace function, you can enter a client MAC address and let the system collect in a single file all the previously generated logs related to this client.
Core Dump and System Report and Debug Bundle menus are used to troubleshoot the WLC platform
The Packet Capture menu only applies to wired capture (physical or VLAN interfaces). Therefore, you should use it only if you suspect that the client issue you are troubleshooting has a strong wired component
If you suspect a wireless component, you can use the AP Packet Capture function. The function works only if you have defined how and where the capture should be stored, and it is available only in older (IOS) APs, like the 17xx/27xx/37xx series and before. Newer APs (18xx/28xx/38xx and 91xx series) do not support this function, which has been superseded by Intelligent Capture on Catalyst Center.
You can also set your APs to Sniffer mode to capture an entire channel and send the captured traffic to a station where Wireshark can analyze the capture.
In some cases, you will conclude that the issue occurs during the 802.1X/EAP authentication phase and that the AAA server is either rejecting the authentication (Authentication Failure) or simply not responding (AAA Timeout message)
In the first case, the WLC will display an authentication failure message. In the second case, the WLC will display a AAA timeout message
In both cases, you may need to go to the Identity Services Engine (ISE) interface to investigate further
For most nonsecurity issues, the WLC, your efforts might lead you to Catalyst Center because WLC does not store historical information and therefore can provide only a live snapshot of the network conditions.
By contrast Catalyst Center is configured to store historical information and can be preferred if you need to look at past events, either in search of a particular point in time when an issue occurred or because you need to compare past states or conditions to the present.
The connection score is 100% if the client connects at the maximum MCS/data rate it supports. In most cases, clients may not be close enough to the AP to connect at max MCS, and a lower connection score may not be of concern
If your client runs Apple iOS 11 or later, you will also see the Client Scan report section in the page. Right after (re)association, the iOS client sends an unsolicited 802.11k neighbor report to its connecting AP, listing all the other APs it detected (for the target SSID) while scanning before it joined the local AP.
Do not be alarmed if the client does not list all APs. When an AP signal is strong, the client may stop scanning and directly join that AP.
Client Troubleshooting in Catalyst Center
When you navigate to Assurance > Dashboards > Health > Client, you see global statistical graphs at the top and then the list of all clients in the Client Devices section. For each client, you can see the username, IP address, device type, latest health score, traffic volume (usage), AP name, band, RSSI, location (and the time the client was last reported)
The health score is a composite index for the client
Catalyst Center defines “good RSSI” as −72 dBm and above, and it defines “good SNR” as 9 dB and above
The client will display a health index of 1 if it failed to complete association, 4 if it connected but has both poor RSSI and poor SNR, 7 if RSSI or SNR gets above the threshold, and 10 if both RSSI and SNR get above the threshold for the connected client.
At the top of the section, you can use Type selection buttons to reduce the display list to only wireless clients or wired clients
only inactive clients, or only clients with poor (4 or less), fair (7 or less), or good health (more than 7).
You can also refine the display with the Data button to show only the clients whose onboarding times exceed key values
(more than 5 seconds for authentication [WebAuth, 802.1X, PSK],
more than 10 seconds for total onboarding time,
more than 5 seconds for association,
more than 5 seconds for DHCP,
less than −72 dBm RSSI,
and less than 9 dB SNR)
You can also use the Filter button and enter a particular client MAC address, IP address, username, or any other criterion for a client (health score, RSSI, connected AP, and so on) to focus your attention on a particular case
The client’s Details page is organized around the idea of performance monitoring and issue root cause analysis.
The top of the page shows a graph of the client health over time. You can use the date on the upper-right part of the screen or the sliders on each side of the graph to change the monitored interval. The default is a sliding 24-hour window.
Below the graph is a list of issues (if any) for the same period
an onboarding section showing the various steps (association, AAA, DHCP) and their status (green or red), a list of frames for each of these events, and a graph of the client connection (SSID, AP, WLC)
However, you will notice that Catalyst Center provides more information than the other interfaces (for example, the count of other clients on the same AP or the WLC, the IP address of the AAA authentication server, and so on)
Lower in the page, the Application Experience section shows the applications used by that client. Instead of providing a list sorted by default by volume, Catalyst Center organizes applications based on their policy classification: Business Relevant, Business Irrelevant, or Default (that is, either business relevant or not, depending on what payload the application carries). In the Catalyst Center Policy menu, you can change this classification.
more…
coming soon